



TL;DR:
- Reading financial statements involves analyzing four key reports to assess a company’s liquidity, profitability, and solvency. The SEC compares this skill to reading a nutrition label, emphasizing that no accounting degree is necessary with a clear understanding of where to look.
Reading financial statements is the process of extracting a company’s financial position and operating performance from four core reports so you can judge liquidity, profitability, and solvency. The SEC compares this skill to reading a nutrition label: you don’t need an accounting degree, just a clear map of what to look for and where.
Your 30-second starting point:
- Locate all four reports (see below) and confirm they cover the same period.
- Scan three headline numbers: total revenue, net income, and cash from operations.
- Run one quick ratio: divide current assets by current liabilities to get the current ratio.
The four core financial statements every complete U.S. filing includes are:
- Balance sheet — a snapshot of what the company owns and owes at one point in time
- Income statement — revenue, expenses, and profit over a period
- Cash flow statement — actual cash moving in and out over a period
- Statement of shareholders’ equity — changes in ownership interest over a period
Table of Contents
- What do the four core financial statements actually tell you?
- How do the statements connect to each other?
- How to read a company’s statements step by step
- Key starter ratios: how to compute them and what the results mean
- What red flags should you watch for in financial statements?
- Mini worked example: reading a simple set of U.S. statements
- Where do U.S. companies publish financial statements?
- Key Takeaways
- Why this skill matters more than most people realize
- Finblog makes the next step easier
- Authoritative sources and further reading
What do the four core financial statements actually tell you?
Each statement answers a different question. Read them as a set, not in isolation.
Balance sheet: what does the company own and owe right now?
The balance sheet is a point-in-time snapshot, typically dated the last day of a quarter or fiscal year. Assets sit on one side; liabilities and shareholders’ equity sit on the other. The equation always balances: Assets = Liabilities + Shareholders’ Equity.
Scan these first: cash and cash equivalents (can the company pay its bills today?), total liabilities (how much does it owe?), and shareholders’ equity (what’s left for owners after debts). A company with $500,000 in cash and $200,000 in short-term debt is in a very different position than one with $50,000 in cash and $400,000 due within 90 days.
For a hands-on look at how a balance sheet is structured with real examples, Finblog’s personal balance sheet guide walks through the layout clearly.
Income statement: did the company make money?
Unlike the balance sheet, the income statement covers a period — a quarter or a full year. Read it top to bottom: revenue at the top, then subtract costs of goods sold to get gross profit, subtract operating expenses to get operating income, account for interest and taxes, and land on net income at the bottom. That “bottom line” is the number most people focus on, but gross profit margin often tells you more about the underlying business.
Cash flow statement: is the company actually generating cash?
Accrual accounting means net income and cash generation can diverge significantly. The cash flow statement reconciles that gap. It covers the same period as the income statement and breaks cash movements into three buckets: operating, investing, and financing activities. Operating cash flow is the one to watch first.
Statement of shareholders’ equity: how is ownership changing?
This statement tracks retained earnings, share issuances, buybacks, and dividends over the period. Watch for big drops in retained earnings (losses eating into the equity base) or heavy share issuances that dilute existing owners.
| Statement | Purpose | Top two line items to scan |
|---|---|---|
| Balance sheet | Snapshot of financial position at one date | Cash; total liabilities |
| Income statement | Profit or loss over a period | Revenue; net income |
| Cash flow statement | Cash generated or used over a period | Operating cash flow; capital expenditures |
| Shareholders’ equity | Changes in ownership interest over a period | Retained earnings; share issuances/repurchases |
Pro Tip: Most beginners stop at net income and call it done. That’s the single most common mistake. A company can report positive net income while burning cash every quarter — and the cash flow statement is where that shows up. Always cross-check the two.
How do the statements connect to each other?
The four reports aren’t independent documents. They’re four windows into the same underlying reality, and the connections between them are where the real diagnostic power lives.
Here’s the flow: the income statement produces net income for the period. That net income flows directly into the statement of shareholders’ equity, increasing retained earnings (or decreasing them if there’s a loss). The ending equity balance then appears on the balance sheet. Meanwhile, the cash flow statement starts with that same net income and adjusts it for non-cash items (like depreciation) and working capital changes to show how much cash actually moved.
A simple numeric example
Suppose a company reports:
- Net income: $100,000
- Depreciation (non-cash expense added back): $20,000
- Increase in accounts receivable (cash not yet collected): ($15,000)
- Operating cash flow: $105,000
The income statement shows $100,000 profit. The cash flow statement shows $105,000 in operating cash — slightly better than net income because depreciation is a non-cash charge. Retained earnings on the equity statement rise by $100,000 (assuming no dividends). The balance sheet’s cash line increases by whatever the net change in cash is after investing and financing activities.
When these numbers tell a consistent story, that’s a good sign. When they diverge sharply — say, net income is $100,000 but operating cash flow is negative — that’s worth investigating.
Reading sequence when using connections as a diagnostic tool:
- Start with the income statement to understand profitability.
- Move to the cash flow statement and compare operating cash flow to net income.
- Check the equity statement to confirm retained earnings changed as expected.
- Return to the balance sheet to verify ending cash and equity balances match.
How to read a company’s statements step by step
Follow this checklist every time you open a set of financials. The order matters.
-
Confirm the period and completeness. Check the dates on each statement. Are you looking at a full year (10-K) or a quarter (10-Q)? Are all four statements present? Are notes included? A set of statements without notes is incomplete.
-
Scan the three headline numbers. Revenue (top of the income statement), net income (bottom of the income statement), and cash from operations (cash flow statement). These three numbers give you a 60-second orientation before you read anything else.
-
Review cash flow from operations. Is it positive? Does it roughly match net income, or is there a big gap? A persistent gap between the two is one of the most reliable early warning signs in financial analysis.
-
Check key balance sheet ratios. Current ratio (current assets ÷ current liabilities) and debt-to-equity (total debt ÷ shareholders’ equity). These two numbers tell you whether the company can meet short-term obligations and how leveraged it is.
-
Read the notes and MD&A. Notes to the financial statements contain accounting policies, debt covenants, contingent liabilities, and unusual transactions. The MD&A section gives management’s own explanation of what drove the numbers. Both are required reading, not optional.
-
Run three quick ratios and compare to prior periods. Current ratio, gross margin, and operating cash flow divided by net income. Compare each to the prior year. A ratio that’s deteriorating over two or three periods is more meaningful than any single data point.
Three starter questions to ask management or an advisor:
- What caused the significant change in cash this period?
- How does the company recognize revenue, and did that policy change?
- Which line items are one-time or non-recurring, and what do the numbers look like without them?
Where to find the statements: For U.S. public companies, go to SEC EDGAR and pull the 10-K (annual) or 10-Q (quarterly). These are the authoritative versions. Company investor relations pages and press releases often include the same numbers, but the EDGAR filing is the one auditors signed off on.
Key starter ratios: how to compute them and what the results mean
Ratio analysis is one of three core techniques beginners use alongside horizontal analysis (comparing periods) and vertical analysis (expressing items as a percentage of a base figure). Start with these five.
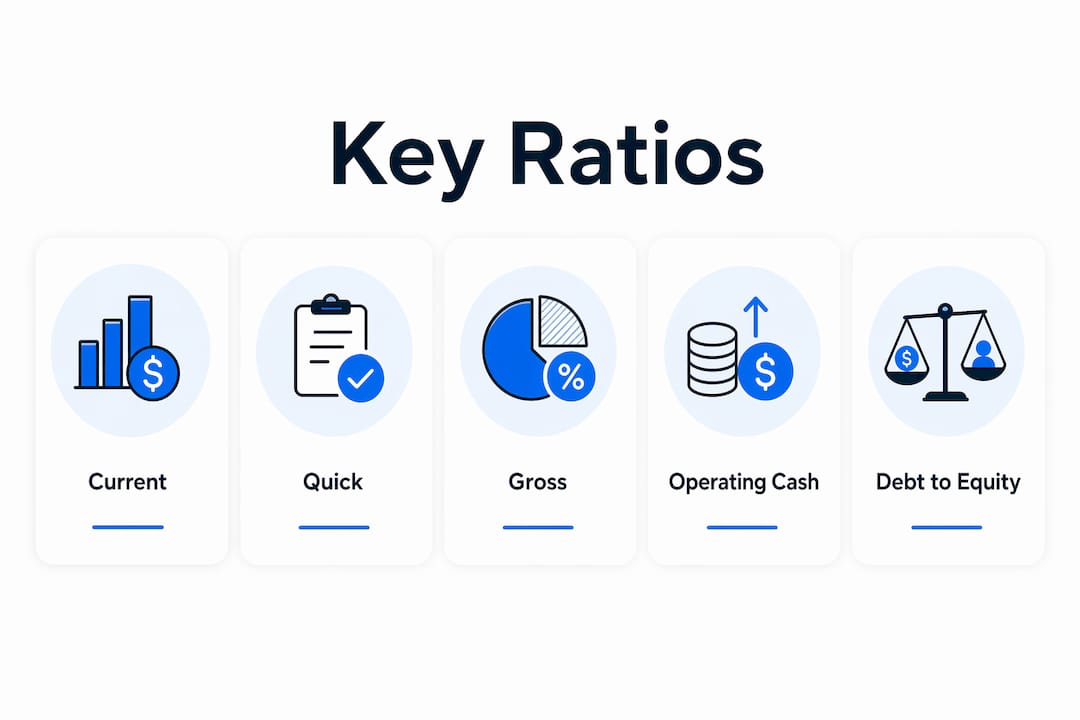
| Ratio | Formula | What it reveals | Red-flag threshold |
|---|---|---|---|
| Current ratio | Current assets ÷ current liabilities | Short-term liquidity | Below 1.0 means liabilities exceed assets due within a year |
| Gross margin | (Revenue − COGS) ÷ revenue | Pricing power and production efficiency | Declining margin over multiple periods |
| Net margin | Net income ÷ revenue | Overall profitability after all costs | Negative or shrinking while revenue grows |
| Debt-to-equity | Total debt ÷ shareholders’ equity | Financial leverage and solvency risk | Above 2.0 warrants scrutiny in most industries |
| OCF / net income | Operating cash flow ÷ net income | Earnings quality | Consistently below 0.8 suggests income may not be converting to cash |

Short calculation examples
Using the synthetic numbers from the worked example below:
Current ratio: $180,000 ÷ $120,000 = 1.5 — the company has $1.50 in current assets for every $1.00 of short-term debt. Acceptable, but not a wide cushion.
Gross margin: ($500,000 − $300,000) ÷ $500,000 = 40% — the company keeps 40 cents of every revenue dollar before operating expenses.
OCF / net income: $85,000 ÷ $60,000 = 1.42 — operating cash flow exceeds net income, which is a healthy sign. Cash earnings are real.
Pro Tip: Before comparing ratios across companies, check whether both use the same accounting policies. A company that capitalizes software development costs will show higher margins than one that expenses them immediately — even if the underlying economics are identical. When in doubt, normalize for one-time items and note any policy differences before drawing conclusions.
What red flags should you watch for in financial statements?
Numbers can be arranged to tell a flattering story. These are the warning signs that suggest you should dig deeper before trusting the headline figures.
Common red flags:
- Consistently negative operating cash flow while net income is positive — the most reliable single warning sign.
- Receivables growing faster than revenue — the company may be booking sales it hasn’t collected.
- Repeated “one-time” gains — if a company reports a one-time item every year, it isn’t one-time.
- Heavy short-term borrowings relative to cash on hand — a liquidity squeeze in the making.
- Frequent goodwill or asset impairments — prior acquisitions aren’t performing as promised.
- Large off-balance-sheet items disclosed only in the notes — operating leases, special purpose entities, and contingent liabilities can be material.
Accounting moves that deserve a closer look
Revenue recognition timing is one of the most common areas of aggressive accounting. A company might record revenue when a contract is signed rather than when the product ships or the service is delivered. The notes will tell you the policy; compare it to industry peers.
Capitalizing expenses means treating a cost as an asset (spreading it over several years) rather than expensing it immediately. This boosts current-period income. Software development costs and certain marketing expenses are frequent candidates. If capitalized costs are rising faster than revenue, ask why.
Off-balance-sheet items used to be a major blind spot before accounting standards tightened, but they still appear. Operating leases, for instance, create real obligations that don’t always show up prominently on the balance sheet. The notes will disclose them.
Pro Tip: When a red flag appears, the first move is always to find the relevant footnote. Notes to the financial statements are where companies disclose the details behind headline numbers. If the footnote raises more questions than it answers, that’s the moment to ask management directly or consult a financial advisor.
Mini worked example: reading a simple set of U.S. statements
The following is a synthetic example with small, rounded numbers. The goal is to practice the pattern, not memorize the amounts.
Sample statements: Acme Co., Year Ended December 31
Income statement
| Line item | Amount |
|---|---|
| Revenue | $500,000 |
| Cost of goods sold | $300,000 |
| Gross profit | $200,000 |
| Operating expenses | $100,000 |
| Operating income | $90,000 |
| Interest expense | $15,000 |
| Income before tax | $80,000 |
| Income tax (25%) | $20,000 |
| Net income | $60,000 |
Balance sheet snapshot (end of year)
| Line item | Amount |
|---|---|
| Cash | $50,000 |
| Accounts receivable | $80,000 |
| Inventory | $50,000 |
| Total current assets | $180,000 |
| Property and equipment (net) | $180,000 |
| Total assets | $400,000 |
| Accounts payable | $20,000 |
| Short-term debt | $80,000 |
| Total current liabilities | $120,000 |
| Long-term debt | $100,000 |
| Shareholders’ equity | $180,000 |
Cash flow summary
| Activity | Amount |
|---|---|
| Operating cash flow | $85,000 |
| Capital expenditures | ($15,000) |
| Financing (debt repayment) | ($20,000) |
| Net change in cash | $85,000 |
Statement of shareholders’ equity (simplified)
| Item | Amount |
|---|---|
| Beginning equity | $120,000 |
| Net income | $60,000 |
| Ending equity | $180,000 |
Step-by-step walkthrough
-
Confirm completeness. All four statements are present. The period is one full year.
-
Scan headline numbers. Revenue is $500,000, net income is $60,000, operating cash flow is $85,000. Net income is positive and operating cash flow exceeds it — a healthy sign.
-
Check the OCF / net income ratio. $85,000 ÷ $60,000 = 1.42. Operating cash flow is stronger than reported earnings, which suggests income quality is solid.
-
Current ratio. $180,000 ÷ $120,000 = 1.5. Adequate but not comfortable. The $80,000 in short-term debt is the main pressure point.
-
Gross margin. $200,000 ÷ $500,000 = 40%. Reasonable for many industries. Compare to prior year to see if it’s holding or compressing.
-
Debt-to-equity. ($80,000 + $100,000) ÷ $180,000 = 1.0. Moderate leverage.
-
Read the notes. Suppose the notes disclose that Acme uses straight-line depreciation over 10 years and that $25,000 of operating income came from a one-time insurance settlement. Strip that out: adjusted operating income is $65,000, not $90,000. That changes the picture meaningfully.
-
Equity reconciliation check. Beginning equity $120,000 + net income $60,000 = $180,000 ending equity. No dividends paid, no share activity. The balance sheet equity matches — the statements are internally consistent.
Verdict: Acme is profitable and generating real cash, but the current ratio is tight and the one-time insurance gain inflates operating income. Follow-up questions: What does operating income look like in the next period without the settlement? Can the company refinance or pay down the $80,000 in short-term debt?
Where do U.S. companies publish financial statements?
Knowing where to find the authoritative version of a filing matters as much as knowing how to read it. Press releases and investor presentations are summaries; the legal documents are what auditors reviewed.
Primary sources, ranked by authority:
- SEC EDGAR (edgar.sec.gov): the definitive source for all public company filings. The 10-K is the annual report; the 10-Q covers each of the first three quarters. These are the versions auditors signed off on.
- Company investor relations pages: usually link directly to EDGAR filings and may include earnings presentations, but always cross-reference with the EDGAR version.
- Annual reports: often include the full financial statements plus a letter from the CEO and additional graphics, but they are marketing documents as well as financial ones. The MD&A section within the annual report or 10-K is management’s own narrative of performance, risks, and outlook.
- Press releases: useful for a quick read on headline numbers, but they often exclude notes and can emphasize adjusted (non-GAAP) figures. Always verify against the full filing.
Why GAAP and the SEC matter
U.S. companies prepare financial statements under Generally Accepted Accounting Principles (GAAP), a standardized framework that makes it possible to compare one company’s financials to another’s. GAAP is set by the Financial Accounting Standards Board (FASB); the SEC enforces disclosure requirements for public companies. Without that standardization, comparing two companies’ income statements would be like comparing distances measured in miles and kilometers without a conversion.
What to check in any filing:
- Filing date (late filings can signal internal control problems).
- Auditor opinion (look for “unqualified” or “clean” opinion; any qualification or going-concern language is a red flag).
- MD&A discussion of known risks, material litigation, and related-party transactions.
- Notes disclosing accounting policies, debt covenants, and contingent liabilities.
For authoritative definitions and accounting guidance, FASB’s website (fasb.org) is the primary reference. For key financial documents and how they fit together in an investment context, Finblog’s overview covers the essentials in plain language.
Key Takeaways
Reading financial statements well comes down to one habit: always read all four reports together, compare operating cash flow to net income, and check the notes before drawing any conclusion.
| Point | Details |
|---|---|
| Four statements, always together | Balance sheet, income statement, cash flow statement, and shareholders’ equity form a complete picture — no single report tells the whole story. |
| Cash flow vs. net income | Compare operating cash flow to net income every time; a persistent gap is the most reliable early warning sign. |
| Three starter ratios | Current ratio, gross margin, and OCF/net income give you a 60-second health check on any company. |
| Notes are not optional | Accounting policies, debt covenants, and one-time items live in the footnotes — skipping them means missing the context that changes headline conclusions. |
| Finblog for next steps | Finblog’s beginner-focused guides and financial education resources support readers who want to apply these skills to real investment and business decisions. |
Why this skill matters more than most people realize
Most people treat financial statements as something accountants read. That’s a costly assumption. Every time you evaluate a job offer from a startup, consider investing in a stock, extend credit to a vendor, or think about buying a small business, you’re making a decision that a set of financial statements could inform directly.
The conventional wisdom is that you need years of accounting training before these documents make sense. That’s wrong. The SEC itself frames financial literacy as a practical skill, not a professional credential. The three checks that matter most — does operating cash flow support net income, are receivables growing faster than revenue, are short-term liabilities manageable — can be learned in an afternoon and applied immediately.
What people underestimate is how much the notes change the story. Headline numbers are the starting point, not the conclusion. A company can report strong net income while quietly disclosing in footnote 14 that a major customer contract expires next quarter, or that a debt covenant requires maintaining a minimum cash balance the company is barely meeting. The readers who catch those details make better decisions than the ones who stop at the income statement.
Mastery doesn’t come from memorizing formulas. It comes from reading statements regularly, asking the same three or four questions every time, and building pattern recognition over months. Start with one company you already know — your employer, a stock you own, a business you’re curious about — and work through the checklist once. The second time is faster. The tenth time, you’ll spot anomalies before you finish the first page.
Finblog makes the next step easier
Reading financial statements is a skill that pays off across every financial decision you make, from evaluating stocks to understanding your own business. Finblog offers beginner-friendly financial education, practical guides, and expert resources designed to take you from basic literacy to confident analysis. Whether you want to go deeper on cash flow, ratio analysis, or investment evaluation, the guides at Finblog are built for readers at exactly this stage. Visit Finblog to explore the full library and find the guide that matches your next question.
Authoritative sources and further reading
These are the primary references for U.S. financial statements. Each one is worth bookmarking.
- SEC Beginners’ Guide to Financial Statements — the clearest plain-language introduction available, written by the regulator itself. Covers all four statements and the notes.
- SEC EDGAR — the official database of all public company filings. Search any U.S. public company to pull its 10-K or 10-Q directly.
- FASB (fasb.org) — the standard-setter for U.S. GAAP. Use it to look up the authoritative accounting rules behind any line item or disclosure.
- Investopedia: Financial Statements — a well-maintained primer with definitions, examples, and links to deeper explanations of individual line items and ratios.
- HBS Online: How to Read Financial Statements — a practical explainer from Harvard Business School Online, useful for readers who want a structured academic framing alongside the regulatory basics.
- U.S. Chamber of Commerce: Key Statements of Financial Reporting — a business-owner-oriented overview that emphasizes narrative context and how to use summarized data alongside detailed numbers.
- PwC: Basic Understanding of a Company’s Financials — a concise professional primer that covers the cash flow statement in particular depth, useful once you’ve worked through the SEC guide.
- Finblog: Complete Guide to Financial Literacy for Beginners — a broader learning path that situates financial statement reading within the larger context of personal and professional financial decision-making.