

TL;DR:
- Compound annual growth rate (CAGR) measures the consistent annual return needed to grow an investment from its starting to ending value over a set period. It provides a smoothed, single ratio for comparing different investments and is calculated using the formula: (Ending Value / Beginning Value)^(1/n) – 1. However, investors should pair CAGR with volatility metrics and be cautious of its limitations, especially in scenarios involving multiple cash flows or volatile periods.
Compound annual growth rate (CAGR) is defined as the geometric mean annual growth rate that links an investment’s beginning value to its ending value over a specified period, assuming profits are reinvested each year. Unlike a simple year-over-year percentage, CAGR produces a single, smoothed rate that tells you exactly what consistent annual return would have taken your portfolio from point A to point B. Finance professionals rely on it to compare mutual funds, equities, and business revenue across different time horizons. You can calculate it by hand, in Excel, or with a financial calculator, and each method produces the same result when applied correctly.

What is compound annual growth rate and how does it work?
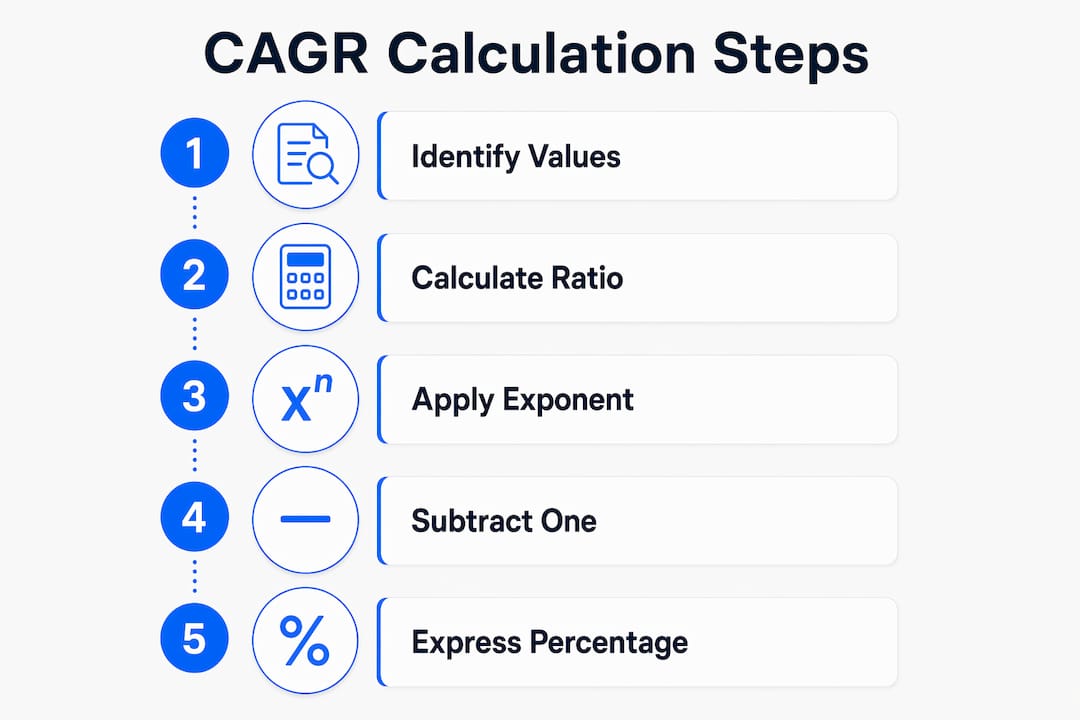
The standard CAGR formula is: CAGR = (Ending Value / Beginning Value)^(1/n) – 1, where n equals the number of years. Three inputs are all you need: the starting value, the ending value, and the time period in years. The formula strips out the noise of volatile interim years and returns the one steady annual rate that would have produced the same final result.
Consider a practical example. You invest $20,000 in an equity fund. After five years, the portfolio is worth $35,000. The calculation is (35,000 / 20,000)^(1/5) – 1, which equals approximately 11.84% per year. That number tells you the fund grew as if it returned exactly 11.84% every single year, even if actual annual returns swung between 3% and 22%.
CAGR is also mathematically identical to the geometric mean of annual returns. Finance expert Ryan O’Connell notes that this equivalence holds for both nominal and inflation-adjusted returns, provided you apply the same basis consistently throughout the calculation.
How to calculate CAGR in Excel
Excel offers three reliable approaches, and each suits a different working style.
- Manual formula entry. Type "=(ending_value/beginning_value)^(1/years)-1` directly into a cell. This mirrors the textbook formula and is easy to audit.
- RRI function. The RRI function syntax is
=RRI(nper, pv, fv), where nper is the number of periods, pv is the present value, and fv is the future value. Excel introduced RRI in 2013, and it reads almost like plain English, which makes spreadsheet audits faster and collaboration easier. - POWER function. Use
=POWER(fv/pv, 1/nper)-1as an alternative to the caret operator. Both produce identical results; POWER is sometimes preferred in complex nested formulas where the caret can cause order-of-operations confusion.
Calculation errors most often stem from three sources: misidentifying the period length (using calendar years when the investment spans partial years), mixing currencies without conversion, and forgetting to exclude mid-period contributions from the beginning or ending value. Each mistake produces a CAGR that looks precise but is meaningless.
Pro Tip: Use the Rule of 72 as a quick sanity check. Divide 72 by your calculated CAGR to estimate how many years the investment takes to double. If your CAGR is 9%, the investment should roughly double in eight years. If that timeline looks wrong given what you know about the asset, revisit your inputs.
CAGR vs. arithmetic average: why the difference matters
Arithmetic average returns consistently overstate real performance when assets are volatile, because they ignore the compounding effect of losses. A simple example makes this concrete: an investment gains 50% in year one and loses 50% in year two. The arithmetic average return is 0%. The actual CAGR is approximately negative 13.4%, because a 50% loss requires a 100% gain just to break even.
This gap widens with volatility. A portfolio that swings dramatically year to year will show a much larger spread between its arithmetic average and its true compound growth rate. For investors evaluating long-term performance, relying on arithmetic averages can create a false sense of progress.
“CAGR measures geometric compounding, which is the only mathematically correct way to express multi-year investment performance. Arithmetic averages are useful for single-period analysis, but they mislead when applied across multiple compounding periods.” — Ryan O’Connell, finance educator
CAGR and the geometric mean are mathematically identical, which is why both produce the same result when applied to the same dataset. Understanding this relationship helps you recognize when a fund manager is quoting arithmetic averages to make performance look better than it actually is. That distinction alone is worth knowing before your next portfolio review.
For investments involving multiple cash inflows or outflows, such as a dollar-cost-averaging strategy or a business with staged capital injections, CAGR is the wrong tool entirely. In those cases, IRR (Internal Rate of Return) or Excel’s XIRR function captures the true return by accounting for the timing and size of each cash flow. Knowing when to switch from CAGR to IRR or XIRR is one of the most practical skills in investment analysis.
Practical applications of CAGR in portfolio management
CAGR’s greatest strength is enabling direct asset comparisons across investments with different starting values, different amounts invested, and different time horizons. Without it, comparing a three-year bond return to a seven-year equity position is an apples-to-oranges exercise. With CAGR, both reduce to a single annualized percentage that sits side by side in a table.
The table below shows how CAGR translates raw portfolio data into comparable performance figures:
| Asset | Beginning value | Ending value | Period | CAGR |
|---|---|---|---|---|
| Equity fund A | $10,000 | $18,000 | 6 years | 10.3% |
| Bond portfolio B | $25,000 | $32,000 | 4 years | 6.4% |
| Real estate fund C | $50,000 | $95,000 | 8 years | 8.3% |
| Tech stock D | $5,000 | $14,000 | 7 years | 15.8% |
Typical long-term benchmarks place equity investment CAGR between 7% and 12% annually, while salary growth tends to run between 3% and 15% depending on industry and role. These ranges give you a reference point when evaluating whether a fund’s reported growth rate is genuinely strong or simply average dressed up in favorable language.
CAGR also anchors long-term financial planning. If your retirement goal requires $1,500,000 in 20 years and you have $300,000 today, you can solve the CAGR formula in reverse to find the required annual growth rate: approximately 8.4%. That number tells you immediately whether your current asset allocation is likely to get you there, or whether you need to adjust your strategy. Finblog’s guide on portfolio performance metrics walks through this kind of goal-based analysis in detail.
Pro Tip: When evaluating mutual funds, always request CAGR figures for 3-year, 5-year, and 10-year periods. A fund with a strong 1-year return but weak 10-year CAGR is often benefiting from a single favorable market cycle rather than consistent management quality. Reviewing equity fund inflows alongside CAGR gives you a fuller picture of market momentum.
Limitations and common pitfalls when using CAGR
CAGR’s smoothing effect is both its strength and its most significant weakness. A fund that lost 40% in year two and recovered strongly by year five can show an attractive CAGR while hiding a period that would have been genuinely painful to live through. The metric tells you nothing about the path, only the destination.
The key limitations every investor should keep in mind:
- Volatility is invisible. Two portfolios with identical CAGRs can have radically different risk profiles. Always pair CAGR with a standard deviation or maximum drawdown figure to understand what the ride actually felt like.
- No interim cash flows. CAGR assumes a single lump sum invested at the start and a single lump sum withdrawn at the end. Any contributions or withdrawals in between distort the result. Use XIRR for those scenarios.
- Start and end point manipulation. Selecting a market trough as the starting point and a peak as the ending point produces an inflated CAGR. Always verify the period used when reviewing third-party performance claims.
- Negative CAGR. When an investment loses value, CAGR turns negative. A portfolio that falls from $100,000 to $70,000 over four years has a CAGR of approximately negative 8.5%. This is meaningful data, not an error in the formula.
- Short periods distort. CAGR calculated over less than two years is statistically unreliable and easily manipulated. Aim for a minimum of three years, and treat five-plus-year figures as the most credible.
Pro Tip: Never present CAGR in isolation to clients or stakeholders. Pair it with a volatility measure and a clear statement of the period used. A CAGR figure without context is a number that can mean almost anything.
Key takeaways
CAGR is the only mathematically sound way to express multi-year investment performance as a single annualized rate, but it must always be paired with volatility data and a clearly defined measurement period to be meaningful.
| Point | Details |
|---|---|
| CAGR formula | Use (Ending Value / Beginning Value)^(1/n) – 1; three inputs are all you need. |
| Excel calculation | The RRI function reduces formula errors and improves spreadsheet auditability. |
| CAGR vs. arithmetic average | Arithmetic averages overstate returns under volatility; CAGR reflects true compounding. |
| When to use XIRR instead | Investments with multiple cash flows require IRR or XIRR, not CAGR. |
| Benchmark context | Long-term equity CAGR typically falls between 7% and 12%; use this range to evaluate fund claims. |
Why I stopped trusting CAGR in isolation
I spent the first few years of my career treating CAGR as the final word on investment performance. A fund showed 12% CAGR over seven years, and I considered the analysis done. What I eventually learned, the hard way, is that CAGR is a starting point, not a conclusion.
The most instructive case I encountered was a real estate fund that reported an 11% CAGR over eight years. Impressive on paper. But when I mapped the annual returns, year three showed a 34% drawdown. Investors who needed liquidity that year were forced to exit at the worst possible time, locking in losses that no subsequent recovery could fix. The CAGR told me nothing about that risk.
My current practice is to always calculate CAGR alongside maximum drawdown and the Sharpe ratio. CAGR answers the question “how much did it grow?” The other two answer “at what cost?” Together, they give you a complete picture. I also default to XIRR the moment any investment involves staged contributions or partial withdrawals. Using CAGR in those situations is not just imprecise. It is actively misleading.
One more thing worth saying directly: be skeptical of any fund or advisor who leads with CAGR and buries the volatility data. The metric is easy to present favorably by choosing convenient start and end dates. Your job as an investor is to ask which period was used and why.
— Povilas
Go deeper on investment growth with Finblog
Understanding CAGR is the foundation, but applying it well requires knowing how it connects to compound interest, portfolio diversification, and broader performance metrics. Finblog covers all of these in depth, from how compound interest builds wealth over decades to the mechanics of compound vs. simple interest that affect every savings and investment decision you make. If you are building or refining a portfolio strategy, the guide on diversification and risk shows how CAGR behaves differently across asset classes when correlation is managed well. Visit Finblog for calculators, guides, and analysis built specifically for serious investors.
FAQ
What is the CAGR formula?
CAGR equals (Ending Value divided by Beginning Value) raised to the power of (1 divided by the number of years), minus 1. The formula requires only three inputs: starting value, ending value, and the investment period in years.
How is CAGR different from average annual growth rate?
CAGR uses geometric compounding and reflects the actual return path of an investment, while the arithmetic average annual growth rate simply adds annual returns and divides by the number of years. Arithmetic averages overstate performance when returns are volatile.
When should I use XIRR instead of CAGR?
Use XIRR when an investment involves multiple cash flows at irregular intervals, such as monthly contributions to a retirement account or staged equity investments. CAGR assumes a single starting and ending value with no activity in between.
What is a good CAGR for an equity investment?
Long-term equity investments typically produce a CAGR between 7% and 12% annually, based on historical market benchmarks. Figures significantly above this range warrant scrutiny of the measurement period and underlying volatility.
Can CAGR be negative?
Yes. A negative CAGR means the investment lost value over the measured period. For example, a portfolio declining from $100,000 to $70,000 over four years produces a CAGR of approximately negative 8.5%, which is a valid and informative result.