
TL;DR:
- Economic indicators are most useful when analyzing their interaction as predictive, real-time, or confirmatory tools.
- Market reactions hinge on surprises relative to expectations, not just absolute indicator values.
- Data revisions, sampling errors, and alternative sources add uncertainty, requiring ongoing skepticism and multiple signals.
Economic indicators are not a crystal ball, and treating any single number as one is a fast track to poor investment decisions. GDP alone does not tell you whether the job market is recovering. Unemployment figures alone cannot predict where inflation is heading. The real insight comes from understanding how leading, lagging, and coincident indicators interact as a system. In this guide, you will learn the three indicator types, which specific metrics move markets most, how the data is built and revised, and how to apply these signals to build a smarter investment strategy in 2026.
Table of Contents
- Types of economic indicators: Leading, coincident, and lagging
- Key economic indicators and their market impact
- How indicators are produced and revised: The mechanics behind the data
- Market reactions and investor strategy: Putting indicators into practice
- The expert edge: What most guides miss about economic indicators
- Next steps: Enhance your investment insight with Finblog
- Frequently asked questions
Key Takeaways
| Point | Details |
|---|---|
| Indicator types matter | Knowing whether an indicator is leading, coincident, or lagging helps you interpret market signals accurately. |
| No single signal is enough | Smart investors combine multiple indicators and stay alert for revisions that change the economic picture. |
| Market reactions are dynamic | Stocks and bonds respond differently to economic surprises, especially with changing inflation and growth rates. |
| Check for revisions | Indicator estimates are regularly updated, so always review the latest data before making decisions. |
| Practical strategy wins | Use context, surprises, and combined signals to build a resilient investment approach. |
Types of economic indicators: Leading, coincident, and lagging
Knowing what type of indicator you are looking at changes how you use it. A number that confirms last quarter’s recession is very different from one that signals next quarter’s recovery. Getting this wrong means reacting to old news or acting on noise.
Economic indicators fall into three types/08:_Business_Cycle/8.05:_Leading_Coincident_and_Lagging_Economic_Indicators): leading (predict future trends, typically 3 to 12 months ahead), coincident (reflect current conditions in real time), and lagging (confirm trends after they have already occurred). Each serves a distinct purpose, and using the wrong type for your investment decision is like checking yesterday’s weather to decide whether to carry an umbrella today.
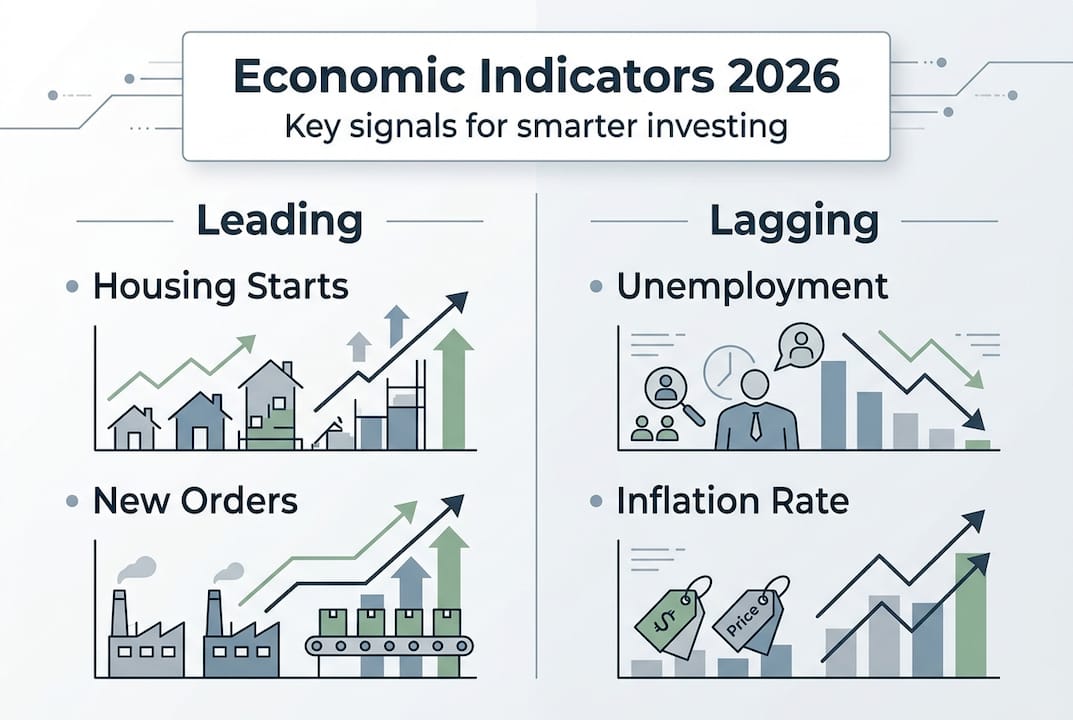
Leading indicators are the most forward-looking tools in an investor’s kit. Consumer confidence surveys, new housing permits, stock market returns, and manufacturing orders all tend to move before the broader economy shifts. When consumer confidence drops sharply over two consecutive months, that is often an early warning that spending will slow. The role of leading indicators is to give you time to reposition before the crowd catches on.
Coincident indicators confirm what is happening right now. GDP growth, industrial production, and personal income levels all move in sync with the current economic cycle. These are the numbers that tell you whether the economy is expanding or contracting at this very moment. They are less useful for predicting the future but essential for validating whether your current portfolio positioning makes sense.
Lagging indicators confirm what has already happened. The unemployment rate is the classic example: it tends to peak after a recession has technically ended, because companies are slow to rehire. The Consumer Price Index (CPI) also lags, reflecting price changes that have already worked through the system. Lagging indicators are useful for confirming a trend, but acting on them alone means you are always one step behind the market.
| Indicator type | Timing | Examples | Best used for |
|---|---|---|---|
| Leading | 3 to 12 months ahead | Consumer confidence, housing permits | Early positioning |
| Coincident | Real time | GDP, industrial production | Validating current strategy |
| Lagging | Post event | Unemployment rate, CPI | Trend confirmation |
Here is a quick summary of how each type serves investors:
- Leading indicators: Spot opportunities before the market prices them in
- Coincident indicators: Confirm whether your current allocation fits the cycle
- Lagging indicators: Validate that a trend is real before doubling down
“The investor who understands indicator timing has a structural advantage over one who reacts to headlines. Knowing whether a number is predictive or confirmatory changes everything about how you act on it.”
For a deeper look at predicting market trends using these signals, the relationship between timing and positioning is covered in detail on our site.
Key economic indicators and their market impact
With the types established, let’s look at specific indicators and their practical market effects. Not all data releases are created equal. Some move markets by fractions; others trigger 1% swings in a single session.

The Big Four recession indicators are employment, industrial production, real retail sales, and real personal income. In 2026, these four metrics are at the center of recession watch, as analysts debate whether slowing growth signals a soft landing or something worse. Each one tells a different part of the story.
Here is how each major indicator connects to market behavior:
- GDP (Gross Domestic Product): A GDP growth rate above 2% generally supports equity markets. A contraction in two consecutive quarters signals recession, which historically triggers broad selloffs. GDP is released quarterly, so it is slow-moving but powerful.
- Nonfarm payrolls (NFP): Released monthly, this is one of the most market-moving reports. A strong jobs number typically pushes stocks higher and bonds lower, as it signals economic health and potential rate hikes.
- CPI (Consumer Price Index): Measures inflation at the consumer level. Hot CPI prints have caused S&P 500 trends to reverse sharply, as investors reprice rate expectations.
- PPI (Producer Price Index): Measures inflation at the wholesale level. PPI often leads CPI by a few months, making it a useful early inflation signal.
- Retail sales: Tracks consumer spending, which drives roughly 70% of U.S. GDP. A surprise drop in retail sales often signals weakening demand before GDP data catches up.
| Indicator | Release frequency | Primary market impact |
|---|---|---|
| GDP | Quarterly | Equity and bond repricing |
| Nonfarm payrolls | Monthly | Stocks up, bonds down on strong data |
| CPI | Monthly | Rate expectations, equity volatility |
| Retail sales | Monthly | Consumer sector stocks |
| Industrial production | Monthly | Manufacturing and energy equities |
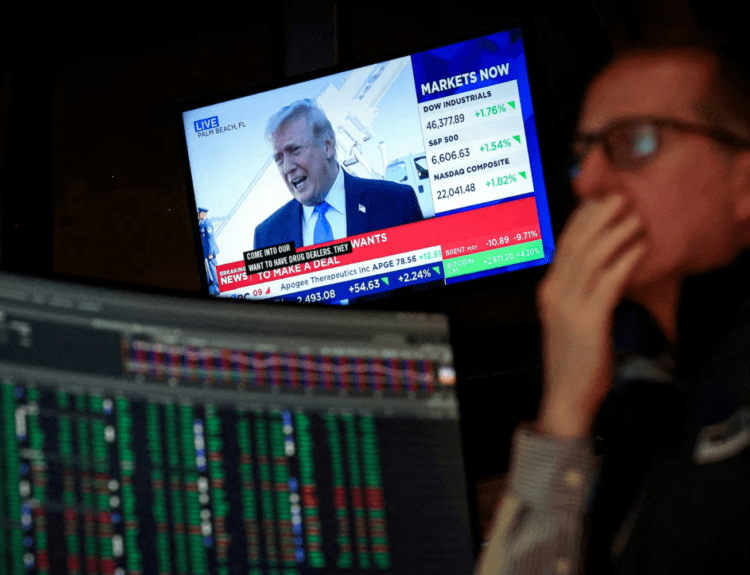
Consider a real scenario: when the January 2026 CPI print came in hotter than expected, traders immediately priced in fewer rate cuts for the year. Bond yields jumped, growth stocks sold off, and the dollar strengthened. That single number shifted billions in positioning within hours. Understanding essential indicators and their market linkages helps you anticipate these moves rather than react to them.
For investors spotting market trends, the key is not just knowing what each indicator measures but understanding which direction a surprise in that indicator will push asset prices.
How indicators are produced and revised: The mechanics behind the data
Understanding what indicators mean is only half the story. Knowing how they are constructed and adjusted is just as important, because the first number released is rarely the final one.
Indicators are built from surveys, administrative records, and Census data, then adjusted using price indexes and seasonal factors. The unemployment rate, for example, comes from the Current Population Survey (CPS), which samples roughly 60,000 households each month. GDP is assembled from hundreds of source datasets, including retail trade surveys, tax records, and import/export data. Industrial production is benchmarked annually and deflated using producer price indexes.
Here is why this matters for investors:
- Sampling error: No survey captures the entire economy. The CPS has a margin of error of roughly plus or minus 100,000 jobs, meaning a “strong” jobs report of 180,000 and a “weak” one of 80,000 could statistically be the same result.
- Response rate decline: Survey response rates have fallen significantly over the past decade, increasing the uncertainty in initial estimates.
- Benchmark revisions: GDP and industrial production are revised annually when more complete data becomes available. These industrial production revisions can shift the picture of economic growth substantially.
- Seasonal adjustments: Data is adjusted for predictable seasonal patterns, but those adjustments can themselves introduce distortions, especially after unusual events like the 2020 pandemic.
A concrete example: the Bureau of Economic Analysis revised its Q3 2023 GDP estimate three times before settling on a final figure. Each revision changed the narrative about economic momentum. Investors who acted aggressively on the first print were sometimes caught on the wrong side of those revisions.
Pro Tip: Always check whether you are looking at an advance estimate, a second estimate, or a final revision before putting significant weight on any GDP or industrial production number. The advance estimate is the least reliable and the most market-moving, which is a dangerous combination.
For investors building key concepts for investors into their process, understanding data mechanics is one of the most underrated skills. It helps you minimize investment risk by avoiding overreaction to preliminary numbers that may be significantly revised.
Market reactions and investor strategy: Putting indicators into practice
Having learned how indicators are built, it is time to use them. Here is how you can apply economic signals to make smarter investment decisions in 2026.
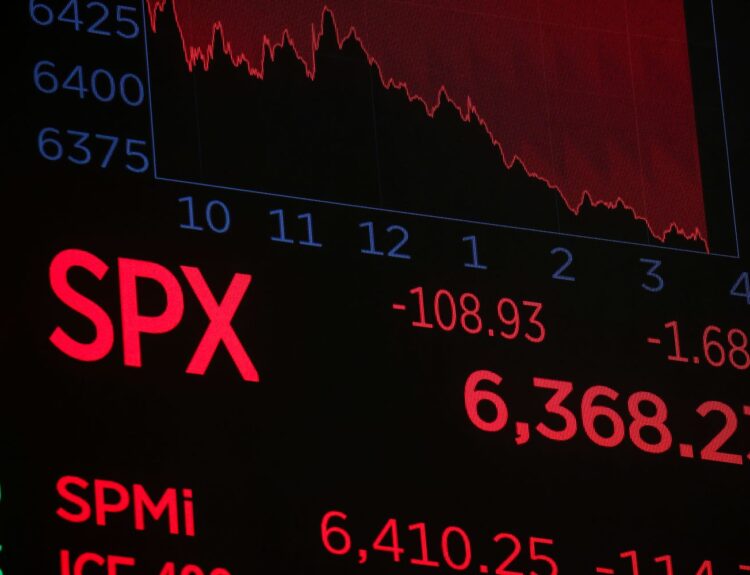
The most important concept for active investors is the surprise factor. Markets do not move on good or bad data alone; they move on data that is better or worse than expected. Strong jobs data boosts stocks but hurts bonds, while a hot CPI print can drop the S&P 500 by an average of 1.2% on the day of release. The market has already priced in consensus expectations, so only surprises create real price movement.
Here is a practical framework for using indicators in your investment strategy:
- Track leading indicators weekly. Monitor consumer confidence, housing starts, and manufacturing PMI (Purchasing Managers Index) to get early signals before the broader market reacts.
- Confirm with coincident indicators. Once leading indicators flash a signal, use GDP and industrial production data to confirm whether the trend is real.
- Use lagging indicators to validate. When unemployment starts falling after a leading indicator predicted recovery, that is your confirmation to increase risk exposure.
- Focus on surprises, not absolutes. A jobs report of 150,000 is irrelevant in isolation. What matters is whether the consensus was 200,000 or 100,000.
- Watch the inflation and growth mix. When inflation and growth risks pull in opposite directions, the traditional stock-bond relationship breaks down. In high-inflation environments, bonds no longer reliably hedge equity risk.
Key signals to monitor in 2026:
- PMI readings above 50 indicate manufacturing expansion; below 50 signals contraction
- A yield curve inversion (short rates above long rates) has preceded every U.S. recession since 1970
- Retail sales growth above 3% year over year typically supports consumer discretionary stocks
Pro Tip: Before any major indicator release, check the consensus estimate from a source like market data reports. Then, when the actual number drops, your first question should not be “is this good or bad?” but “how far is this from what the market expected?” That gap is where the trading opportunity lives.
One important caution: correlations shift. In low-inflation periods, strong jobs data boosted both stocks and bonds. In high-inflation periods, the same data hurts bonds and creates mixed signals for stocks. If you want to understand where markets are heading, resist the urge to rely on any single historical relationship. Context always matters.
The expert edge: What most guides miss about economic indicators
Most articles on economic indicators stop at definitions. Here is what they skip.
The real challenge in 2026 is not understanding what indicators measure. It is knowing when to trust them. No single indicator is perfect; combining multiple signals gives a better picture, but even that picture is imperfect because revisions, declining response rates, and political pressures on statistical agencies introduce genuine uncertainty into the data.
We are also seeing a rise in alternative data sources: satellite imagery of parking lots to estimate retail traffic, credit card transaction data to track spending in real time, and shipping container counts to gauge trade activity. These tools are gaining traction among institutional investors because they provide signals before official data is released. For individual investors, following analysts who use these sources can give you an edge over those relying solely on government releases.
The uncomfortable truth is that key concepts for investors like indicator analysis require ongoing skepticism. When an indicator tells a story that seems too clean, that is often the moment to pause. Markets are complex systems, and economic data is a lagged, sampled, revised approximation of that complexity. Use it as one input among many, not as a verdict.
Next steps: Enhance your investment insight with Finblog
Understanding economic indicators is a skill that compounds over time. The more you practice reading data releases, tracking surprises, and connecting indicators to market movements, the sharper your investment instincts become. At Finblog, we publish guides, analyses, and market breakdowns designed specifically for investors who want to move beyond headlines and understand what is actually driving markets. For ongoing coverage of latest economic indicator insights and practical strategies for 2026, explore our full library of investment resources. Sign up to stay updated and never miss a market-moving data release again.
Frequently asked questions
What is the difference between leading, coincident, and lagging economic indicators?
Leading indicators predict future market trends, coincident indicators measure the economy as it is right now, and lagging indicators confirm patterns after events have already occurred.
How do market reactions to economic indicator releases affect investment decisions?
Markets move based on how far actual results deviate from consensus expectations; strong jobs data typically lifts stocks while a hot CPI print tends to push both stocks and bonds lower.
Can one economic indicator predict a recession or recovery reliably?
No single indicator is fully reliable; combining several signals like the Big Four gives a more complete but still imperfect forecast of economic direction.
What are the main risks and limitations of economic indicators?
Indicators are subject to sampling errors and declining survey response rates, and initial estimates are frequently revised, sometimes significantly changing the economic picture.
How should investors use economic indicators in their strategy?
Track leading indicators for early signals, confirm with coincident and lagging data, and always focus on surprises relative to consensus rather than the absolute number released.