



A compound interest calculator projects your future balance from five inputs: principal, interest rate, time, compounding frequency, and any recurring contributions. Enter those, and it returns future value, total contributions, and total interest earned. The numbers it gives you are nominal, not adjusted for inflation or taxes, so that final piece is on you.
TL;DR:
- Changing compounding frequency from monthly to daily slightly increases your future balance, but the rate change has a much larger impact.
- Contribution timing, especially depositing at the start of the period, can add up to significant interest accrual over decades.
- Inflation and taxes significantly reduce the real value of projected balances, so adjustments are essential for accurate planning.
- Relying on a single rate assumption over long periods can lead to misleading forecasts; running conservative, base, and optimistic scenarios is crucial.
- For precise projections, compare nominal rates with APY and verify calculations using official tools like Investor or MoneySmart.
Table of Contents
- How to Read Your Compound Interest Calculator Results
- How Do You Set Up a Compound Interest Calculation?
- The Compound Interest Formula and a Worked Example
- Why Contribution Timing and Compounding Frequency Change Your Outcome
- How Do You Adjust Projections for Inflation and Taxes?
- Common Mistakes That Skew Your Projections
- What Readers Actually Use This Calculator For
- Get a Personalized Growth Projection
- Where to Verify the Math Yourself
- Sources
How to Read Your Compound Interest Calculator Results
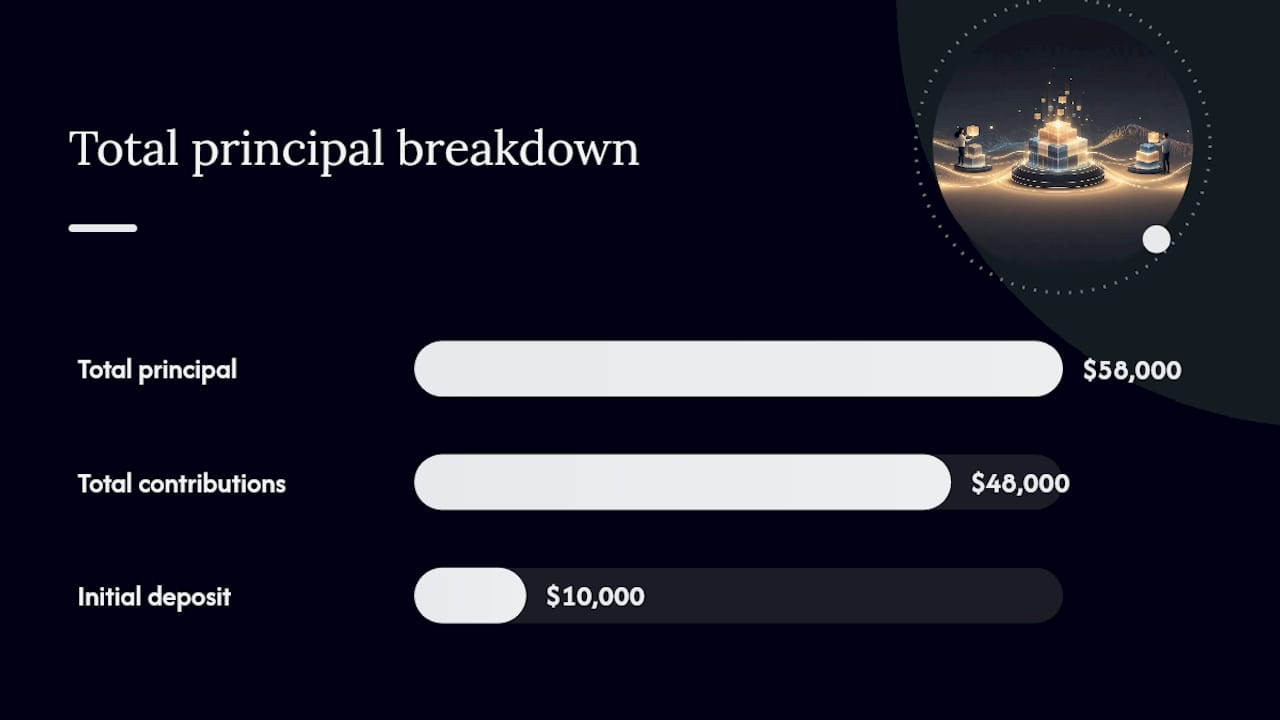
The output screen usually shows three numbers, and confusing them is the most common mistake people make. Future value is your total ending balance. Total principal (sometimes labeled “total contributions”) is every dollar you personally put in, including the initial deposit. Total interest is simply the difference between the two, the part the calculator did for you.
A fourth field worth watching is effective APY, or effective annual yield. This tells you the real annual return once compounding frequency gets factored in, and it’s often higher than the nominal rate you typed in. A 6% nominal rate compounded monthly produces a slightly higher effective yield than 6%, because interest is earned on interest multiple times a year instead of once.
You’d expect to see:
- Future value: a balance in the hundreds of thousands
- Total principal: your $10,000 plus $48,000 in contributions
- Total interest: the amount above that total principal sum
Change the compounding frequency from monthly to daily and the future value ticks up slightly. Change the rate from 6% to 7% and it jumps substantially. That sensitivity is exactly what the tool exists to show you.
How Do You Set Up a Compound Interest Calculation?
Running the numbers well takes about four decisions and a couple of test scenarios.
- Pick your starting principal. If you’re modeling a fresh emergency fund, try $1,000 or $5,000. For an existing brokerage account, plug in the actual balance.
- Choose an annual rate. Confirm whether the number you have is APY or a nominal rate, since financial institutions quote both and they aren’t interchangeable. Savings accounts commonly run a few percent interest, while long-term stock market averages tend to be moderately higher before inflation.
- Select compounding frequency. Most calculators offer annual, monthly, daily, or continuous. Banks typically compound daily or monthly; bonds often compound semiannually.
- Decide contribution timing. Choose beginning of period if you deposit on payday at the start of the month, end of period if you deposit later.
Three scenarios worth running: a one-time lump sum with no further deposits, a $100 to $300 monthly saver building a habit, and a retirement projection stretched over 25 to 30 years.
The Compound Interest Formula and a Worked Example
The standard compound interest formula is:
A = P(1 + r/n)^(nt)
- A = the ending amount (future value)
- P = principal, your starting amount
- r = annual interest rate, written as a decimal (5% becomes 0.05)
- n = number of compounding periods per year
- t = number of years
Here’s the math with real numbers: P = $10,000, r = 5% (0.05), n = 12 (monthly), t = 10 years.
That’s $6,470 in interest on a $10,000 deposit, with no further contributions, over a decade. Compare that against simple interest on the same terms and the gap between the two grows every year that passes, which is the whole case for letting money sit.
For theoretical comparisons, continuous compounding uses A = Pe^(rt), representing the mathematical limit of compounding frequency. Retail banks rarely quote continuous rates, but it’s the ceiling monthly or daily compounding approaches.
Want a gut check without a calculator? The Rule of 72 estimates doubling time: divide 72 by your interest rate. At 6%, your money doubles in roughly 12 years.
Why Contribution Timing and Compounding Frequency Change Your Outcome
A single $10,000 lump sum grows differently than $50 a week deposited over the same span, even if the total dollars invested end up similar, because periodic deposits spend less average time compounding than money invested up front.
Contribution timing matters more than most people assume. Depositing at the beginning of each period rather than the end means that contribution earns interest for one additional compounding cycle. The gap per deposit is tiny, maybe a few cents on a $200 monthly contribution, but stretched across 20 or 30 years and hundreds of deposits, it adds up to real money.
Compounding frequency works the same way, just smaller. Moving from monthly to daily barely moves the needle further. The frequency matters most at higher rates and longer time horizons.
- Lump sum: maximum compounding time, no ongoing effort
- Periodic deposits: builds a saving habit, slightly less efficient per dollar
- Beginning-of-period contributions: small, consistent edge over end-of-period
Pro Tip: If your calculator lets you toggle contribution timing, run both versions once. Seeing the dollar gap yourself makes the “pay yourself first” advice feel less like a cliché and more like arithmetic.
How Do You Adjust Projections for Inflation and Taxes?
A calculator’s future value is nominal. It doesn’t know inflation exists and it doesn’t know your tax bracket. Both matter enormously over long horizons.
- Adjusting for inflation: divide your nominal future value by (1 + inflation rate)^t. A $100,000 nominal balance in 20 years at 3% average inflation is worth roughly $55,000 in today’s purchasing power.
- Adjusting for taxes: if your gains are taxable, reduce your input rate to an after-tax rate before running the calculation, rather than taxing the final number, since tax drag compounds too.
- Comparing accounts fairly: always compare APY, not nominal rate, when shopping between savings products, since a 5% rate compounded daily beats a 5.1% rate compounded annually in some cases.
Running the same figures through more than one account structure makes these adjustments easier to see side by side.
Common Mistakes That Skew Your Projections
The biggest error is trusting a single rate assumption for 20 or 30 years straight. Markets don’t move in straight lines, so run a conservative, base, and optimistic scenario every time instead of anchoring to one number.
- Ignoring fees: even a 1% annual expense ratio compounds against you the same way interest compounds for you.
- Forgetting taxes and inflation, which together can cut real returns by a third or more over decades.
- Mismatching contribution timing with your actual deposit schedule, which throws off precision on longer projections.
- Skipping the Rule of 72 gut check, which catches obviously wrong inputs before you build a plan around them.
Pro Tip: Save or export each scenario you run, especially before a planning conversation. Comparing three saved projections side by side is far more useful than reciting numbers from memory.
For a closer look at how the gap between compound and simple interest plays out over time, that comparison is worth a separate read.
What Readers Actually Use This Calculator For

Most readers reach for a compound interest calculator with one of three goals in mind: sizing an emergency fund, sanity checking a retirement number, or figuring out whether a one time investment is worth making now. None of those goals require complicated math, just clean inputs and a willingness to test more than one scenario.
Finblog builds its projections and market commentary around the same principle: numbers only help when you understand what’s feeding them. If your situation involves multiple accounts, irregular contributions, or tax complexity a simple calculator can’t model, that’s the point to talk to an advisor rather than keep adjusting sliders.
— Povilas
Get a Personalized Growth Projection
A calculator gives you the math. It won’t tell you which account type fits your tax situation, whether your contribution schedule makes sense given your income, or how to sequence multiple goals without shortchanging one of them. That’s where a real conversation earns its keep.
A financial guidance service can provide advice built around your actual numbers, not a generic rate assumption. If you’ve run your own projections and want a second opinion, or if you’re staring at a six-figure retirement gap and don’t know which lever to pull first, request a consultation through Finblog and get feedback that accounts for your full picture, not just principal and rate.
Where to Verify the Math Yourself
Cross-check any projection against the Investor or Australia’s MoneySmart compound interest tool, both free and formula-transparent. For scenario limits and volatility context, the Cash Flow Visualiser illustrates why real outcomes drift from fixed-rate projections.
This article is general information, not a substitute for advice from a qualified financial advisor. Consult a qualified financial professional about your own circumstances before acting on anything here.
Sources
- Contemporary Mathematics — Compound interest (OpenStax)
- Investor
- Compound Interest — LibreTexts (effective yield explanation)