

TL;DR:
- Lagging indicators confirm past results such as revenue and churn, while leading indicators predict future performance like pipeline velocity. Implementing both in a causal system enables organizations to manage proactively and validate strategies effectively. Regular validation and matching review cadences ensure these metrics provide reliable insight and support strategic adjustments.
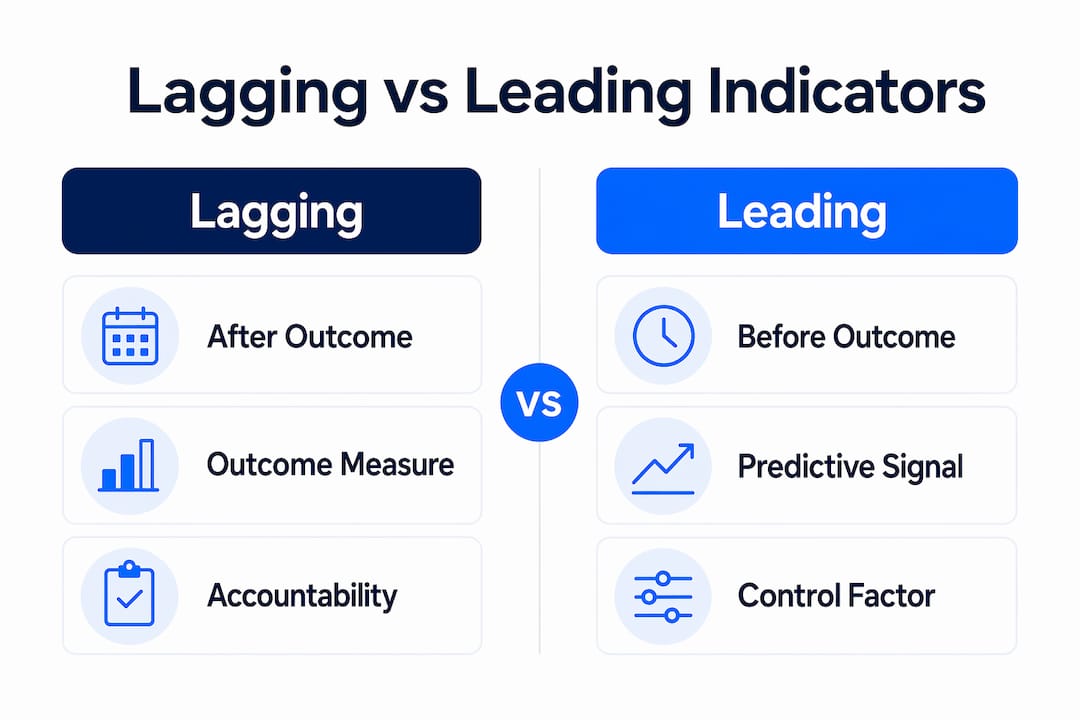
Lagging indicators measure outcomes after they occur, while leading indicators predict future performance before results materialize. Understanding the difference between lagging and leading indicators separates reactive managers from analysts who actually shape outcomes. Revenue, churn rate, and net promoter score confirm what already happened. Pipeline velocity, customer activation rate, and product usage frequency tell you where performance is heading. Both financial indicator types belong in every serious measurement framework, and knowing when to use each one determines whether your strategy responds to the past or anticipates the future.
What are the key differences between lagging and leading indicators?
Leading indicators change before the outcome they explain; lagging indicators measure outcomes after events have occurred. That single distinction drives every practical difference between the two.

Timing is the most obvious gap. A lagging indicator like annual revenue only appears after the sales cycle closes. A leading indicator like sales pipeline coverage gives you a read on next quarter’s revenue weeks before the quarter ends. The lag is structural, not a flaw. It reflects the time required for inputs to compound into outputs.
Control is the second distinction. You cannot directly change revenue. You can change the number of qualified leads your team generates, the conversion rate at each pipeline stage, or the average deal size. Those upstream inputs are leading metrics. They are the levers. Lagging metrics are the scoreboard.
Feedback loops work differently for each type. Lagging indicators confirm results and hold teams accountable. Leading indicators enable course correction while there is still time to act. A safety program that tracks injury rates (lagging) alongside near-miss reports and safety training completion (leading) can intervene before an injury happens rather than analyze why one occurred.
The challenge with leading metrics is that they carry predictive uncertainty. A metric that predicted revenue reliably last year may lose that relationship if the market shifts or the product changes. Pairing each leading indicator with the lagging outcome it predicts and validating their movement together is the only way to confirm the relationship holds.
| Dimension | Lagging indicators | Leading indicators |
|---|---|---|
| Timing | After the outcome | Before the outcome |
| Controllability | Low. Confirms results | High. Actionable inputs |
| Reliability | High. Factual record | Lower. Predictive estimate |
| Review cadence | Monthly or quarterly | Weekly or biweekly |
| Example | Revenue, churn rate | Pipeline velocity, activation rate |
Pro Tip: Never treat a leading indicator as a target in isolation. Tie every leading metric to the lagging outcome it is supposed to predict, then track both together for at least two full cycles before trusting the relationship.
How are lagging and leading indicators used in practice?
The most useful way to understand these metrics is through specific examples across business contexts.
Common lagging indicators in business and finance:
- Revenue and gross margin confirm whether pricing and sales execution worked
- Customer churn rate reveals retention performance after customers have already decided to leave
- Burn multiple (net burn divided by net new ARR) measures capital efficiency after spending has occurred
- Employee turnover rate reflects culture and management quality after people have resigned
- Net promoter score captures satisfaction after the customer experience has been delivered
Common leading indicators across domains:
- Pipeline velocity (deal value multiplied by win rate, divided by sales cycle length) predicts revenue weeks in advance
- Customer activation rate in SaaS products signals whether new users will convert to paying subscribers
- Product usage frequency predicts retention before renewal decisions arrive
- Job postings and building permits function as early economic signals for sector growth
- Safety training completion rates predict workplace injury frequency before incidents occur
The Conference Board’s framework makes this structure explicit at the macroeconomic level. The Leading Economic Index signals near-term direction while the Coincident Economic Index confirms present conditions and lagging indicators like unemployment duration follow afterward. Stock market analysts use this sequence to position portfolios ahead of economic turning points rather than reacting to confirmed recessions.
In SaaS product management, the pairing looks like this: customer activation rate (leading) predicts 90-day retention (lagging). If activation drops in week one, the retention number will follow in month three. Acting on the leading signal gives product teams time to intervene with onboarding improvements before the churn number appears in the board report.
Financial planning teams use burn multiple as a lagging check on capital efficiency while monitoring pipeline coverage and sales cycle length as leading signals for revenue forecasting. The two types work together. Neither one alone gives you the full picture.
What nuances and challenges arise when choosing leading vs lagging metrics?
Selecting and maintaining indicators is harder than most frameworks suggest. Four specific challenges come up repeatedly in practice.
Goodhart’s Law is the most dangerous trap. When a measure becomes a target, it ceases to be a good measure. Optimizing leading indicators too aggressively can cause them to lose predictive power because teams learn to hit the metric without producing the underlying behavior it was designed to capture. A sales team that games “number of discovery calls” by logging low-quality conversations will show strong leading metrics and weak lagging revenue. Continuous validation of the causal link is the only defense.
Variable lead times create a second problem. The lead/lag relationship varies by cycle, so leading indicators should be treated as directional signals rather than exact timing forecasts. In economic analysis, the same leading indicator may precede a recession by six months in one cycle and fourteen months in the next. Communicating this uncertainty to executives prevents overconfident decisions based on a single signal.
Context determines classification. Many metrics function as lagging or leading depending on causal placement and the time window evaluated. Customer satisfaction score is a lagging indicator of service quality and a leading indicator of renewal probability. Treating any metric as permanently one or the other is a modeling error. Build a causal map first, then assign classifications based on position in the chain.
Monitoring cadence matters more than most analysts realize. Checking lagging metrics weekly creates noise, while checking leading metrics only monthly defeats their early warning purpose. Quarterly financial planning cycles work well for lagging financial outcomes. Weekly or biweekly reviews suit leading operational metrics where early signals need fast responses.
Pro Tip: Build a simple causal diagram before assigning any metric as leading or lagging. Draw an arrow from the input to the output. The metric closer to the cause is leading. The metric closer to the effect is lagging. This prevents misclassification and clarifies which metrics you can actually influence.
How can organizations implement both indicator types effectively?
A structured approach to integrating lagging and leading indicators produces better decisions than ad hoc metric selection. Here is a sequence that works in practice.
-
Define your lagging outcomes first. Start with the results that matter: revenue growth, customer retention, operating margin, safety incident rate. These are your accountability anchors. Every leading indicator you select must connect to one of them.
-
Map the causal chain upstream. For each lagging outcome, identify the two or three inputs that most directly drive it. Use historical data, not intuition. If you cannot show a statistical or logical relationship between the leading metric and the lagging outcome, the metric is not a leading indicator. It is just an activity measure.
-
Apply the Balanced Scorecard framework. Kaplan and Norton’s Balanced Scorecard balances leading and lagging indicators across financial, customer, internal process, and learning perspectives. This prevents organizations from managing only with backward-looking financials and forces explicit attention to the operational drivers of future performance.
-
Align monitoring cadence to indicator type. Review lagging financial outcomes monthly or quarterly. Review leading operational metrics weekly. Mismatched cadence is one of the most common reasons performance systems fail to generate useful signals.
-
Design separate dashboards for executives and operators. Two-tier reporting allows executives to focus on lagging confirmations while operational teams track leading signals for timely course corrections. A CFO reviewing monthly revenue does not need daily pipeline stage data. A sales manager does.
-
Validate and retire indicators on a schedule. Set a review cadence of at least once per year to test whether each leading indicator still predicts its paired lagging outcome. Markets shift, products evolve, and customer behavior changes. An indicator that was predictive in 2023 may be decorative by 2026.
Key takeaways
Leading and lagging indicators work as a system: leading metrics tell you where performance is heading, while lagging metrics confirm whether your strategy actually delivered results.
| Point | Details |
|---|---|
| Timing defines the distinction | Lagging indicators confirm past outcomes; leading indicators signal future performance before it arrives. |
| Control sits with leading metrics | You cannot directly change revenue, but you can change pipeline velocity, activation rates, and usage frequency. |
| Validate every leading indicator | Pair each leading metric with the lagging outcome it predicts and test the relationship across multiple cycles. |
| Cadence must match indicator type | Review lagging metrics monthly or quarterly; review leading metrics weekly to preserve their early warning value. |
| Context determines classification | The same metric can be leading or lagging depending on its causal position. Build a causal map before assigning roles. |
Why I think most teams get this backwards
Most organizations I have seen treat lagging indicators as their primary management tool and add leading indicators as an afterthought. The board wants revenue. The CFO tracks margin. The quarterly review centers on what already happened. Leading metrics get mentioned in team meetings and then quietly ignored when they conflict with the story the lagging numbers are telling.
That is exactly backwards. Lagging indicators are for accountability and validation. They tell you whether the strategy worked. Leading indicators are for management. They tell you whether the strategy is working right now, while you still have time to adjust. The Balanced Scorecard framework was built specifically to correct this bias, and it has been around since the 1990s. The fact that most organizations still manage primarily from financial outcomes suggests the lesson has not fully landed.
The other mistake I see constantly is treating leading indicators as permanent fixtures once they are established. A metric that predicted churn reliably during your growth phase may stop working once your customer base matures and the drivers of retention shift. Goodhart’s Law accelerates this decay when teams start optimizing the metric directly. The only honest response is to validate the predictive relationship on a regular schedule and retire indicators that no longer earn their place. For investors tracking market cycles, resources like Do Not Bull offer frameworks for applying leading economic signals without over-indexing on any single data point.
The goal is not to pick a side between leading and lagging. The goal is to build a measurement system where each type does the job it is actually suited for.
— Povilas
Deepen your performance measurement practice with Finblog
The concepts in this article connect directly to how analysts and investors apply economic and financial data in real decisions. Finblog covers the full spectrum of financial indicator types, from macroeconomic signals to portfolio-level metrics. If you want to see how leading indicators apply to market trend analysis or understand how to structure your quarterly financial planning around both indicator types, those resources are a natural next step. Finblog also covers when to update your financial plan as conditions change, which maps directly to the validation and cadence principles covered here.
FAQ
What is the main difference between lagging and leading indicators?
Lagging indicators measure outcomes after they have occurred, such as revenue or churn rate. Leading indicators measure inputs or early signals that predict future outcomes, such as pipeline velocity or customer activation rate.
Can the same metric be both a leading and a lagging indicator?
Yes. A metric’s classification depends on its causal position and the time window evaluated. Customer satisfaction, for example, is a lagging indicator of service quality and a leading indicator of renewal probability.
How often should you review leading vs lagging indicators?
Leading indicators should be reviewed weekly or biweekly to preserve their early warning value. Lagging indicators are best reviewed monthly or quarterly, since more frequent review introduces noise without adding useful signal.
What is Goodhart’s Law and why does it matter for leading indicators?
Goodhart’s Law states that when a measure becomes a target, it ceases to be a good measure. Teams that optimize leading metrics directly can hit the number without producing the underlying behavior, which breaks the predictive relationship with the lagging outcome.
What is the Balanced Scorecard and how does it use both indicator types?
The Balanced Scorecard, developed by Kaplan and Norton, integrates leading operational metrics with lagging financial outcomes across four business perspectives. It prevents organizations from managing exclusively with backward-looking financial data by forcing explicit attention to the drivers of future performance.