



TL;DR:
- Bond yields are dynamic, shifting constantly with market prices, inflation, and Federal Reserve policies.
- Understanding bond yields helps investors interpret economic signals, compare investments, and manage interest rate risk effectively.
Most investors treat bond yields like a fixed label on a jar. They see a percentage, assume it’s static, and move on. That misconception is expensive. Bond yields explained properly reveal something far more dynamic: a number that shifts constantly with market prices, inflation, and Federal Reserve policy. Understanding bond yields isn’t a nice-to-have. It’s the foundation for reading economic signals, comparing fixed income investments, and protecting your portfolio from interest rate risk. This article breaks down yield calculations, the price-yield relationship, yield curve signals, and what inflation actually does to your real returns.
Table of Contents
- Key takeaways
- Bond yields explained: definitions and types
- The inverse relationship between bond prices and yields
- The yield curve and what it signals
- How inflation and interest rates affect your bond returns
- My take on bond yields for individual investors
- Deepen your bond knowledge with Finblog
- FAQ
Key takeaways
| Point | Details |
|---|---|
| Yields move with prices | When a bond’s market price falls, its yield rises. The two always move in opposite directions. |
| YTM is the best measure | Yield to Maturity captures total return including coupon payments and price appreciation or loss. |
| Yield curve predicts recessions | An inverted yield curve has historically preceded economic downturns by 12 to 18 months. |
| Inflation erodes real returns | Nominal yields can look attractive while real purchasing power quietly declines. |
| Duration controls your risk | Longer-duration bonds suffer bigger price swings when interest rates change. |
Bond yields explained: definitions and types
A bond yield is the return you earn on a bond relative to its current price. That sounds simple enough. The confusion starts when people conflate the coupon rate with the yield, treating them as the same thing.
The coupon rate is fixed at issuance. If you buy a $1,000 bond with a 5% coupon, it pays you $50 a year. That never changes. The yield, on the other hand, depends on what you paid for the bond. If you bought it at $900 in the secondary market, your current yield is higher than 5% because you’re still collecting $50 on a smaller investment.
Here’s a quick breakdown of the three yield types every investor needs to know:
- Nominal yield (coupon rate): The fixed annual interest payment divided by the bond’s face value. This never changes once a bond is issued.
- Current yield: Annual coupon payment divided by the bond’s current market price. Moves daily as prices fluctuate.
- Yield to Maturity (YTM): The total annualized return assuming you hold the bond until it matures, accounting for all coupon payments plus any gain or loss from buying at a discount or premium.
YTM is the number that actually matters for comparing bonds. It’s essentially the bond’s internal rate of return, discounting all future cash flows back to the purchase price. A bond bought below face value has a YTM above its coupon rate. A bond bought above face value has a YTM below it.
Bond yield calculation for YTM (simplified):
YTM ≈ (Annual Coupon + (Face Value − Market Price) / Years to Maturity) / ((Face Value + Market Price) / 2)
So for a $1,000 bond paying $60 annually, priced at $950 with 10 years to maturity: YTM ≈ ($60 + $5) / $975 ≈ 6.67%. That’s meaningfully higher than the 6% coupon rate.
Pro Tip: YTM assumes you reinvest all coupon payments at the same yield rate. In practice, reinvestment rates vary, so your actual realized return will often differ from the quoted YTM. Use YTM for comparison, not as a guarantee.
The inverse relationship between bond prices and yields
This is the concept that trips up the most investors, and it’s worth spending real time on. Bond prices and yields move in opposite directions. Always.
Here’s why. When you buy a bond, you’re locked into a fixed coupon. If interest rates rise and new bonds start offering better coupons, your old bond becomes less attractive. The only way your bond can compete is if its price drops enough to make the yield equivalent to what’s available in the market. The price-yield inverse relationship is the market’s mechanism for keeping older bonds competitively priced.

Put numbers on it. You hold a bond with a 5% coupon. New bonds are issued at 10%. To offer an equivalent yield, your bond’s price must fall far enough to make that 5% coupon look like a 10% return. That could mean a price drop of nearly 50%. This is not hypothetical math. It’s the mechanical reality behind every bond market sell-off.
The table below clarifies how price and yield interact across bond types:
| Bond type | Price relative to face value | Yield vs. coupon rate | Common scenario |
|---|---|---|---|
| Par bond | Equal to face value | Yield equals coupon rate | Purchased at issuance |
| Discount bond | Below face value | Yield exceeds coupon rate | Interest rates have risen since issuance |
| Premium bond | Above face value | Yield is below coupon rate | Interest rates have fallen since issuance |
Pro Tip: If you’re buying bonds in the secondary market, always check the YTM, not just the coupon. A premium bond with a high coupon can actually deliver a lower return than a discount bond with a modest coupon.
Understanding what are bond yields in this context matters for active fixed income investors who trade before maturity. If you plan to hold to maturity, price fluctuations are largely irrelevant. If you might sell early, they are your entire risk.
The yield curve and what it signals
The yield curve is a chart that plots bond yields at different maturities, typically from 3-month Treasury bills out to 30-year Treasury bonds. Its shape tells you what the market collectively expects about growth, inflation, and monetary policy. Learning to read it is one of the most useful skills in investing.
The yield curve shape and slope reflects market expectations for future interest rates and risk premiums. There are three shapes to know:
- Normal (upward sloping): Long-term yields are higher than short-term yields. This reflects typical risk premiums and growth expectations. Investors demand more compensation for locking money up longer.
- Flat: Short and long-term yields are roughly equal. This signals uncertainty. Markets aren’t sure whether growth will accelerate or slow.
- Inverted: Short-term yields exceed long-term yields. This is the one that matters most. An inverted curve historically precedes recessions by roughly 12 to 18 months. It has preceded every U.S. recession since the 1970s.
As of May 2026, the U.S. 10-year Treasury yield hovered near 4.7%, a level that raises legitimate questions about stock valuations and borrowing costs across the economy.
For portfolio strategy, the yield curve also informs how you structure bond holdings. Three common approaches:
- Bullet strategy: Concentrate all maturities around a single target date. Useful when you need capital at a specific time.
- Barbell strategy: Hold short-term and long-term bonds simultaneously, with little in the middle. Captures high long-term yields while keeping short-term flexibility.
- Ladder strategy: Spread bonds across multiple maturities. As each bond matures, proceeds get reinvested. Reduces reinvestment risk and smooths income.
There’s also a passive technique worth knowing called roll-down, where a bond’s yield declines naturally as it ages toward maturity on a normal yield curve, generating quiet capital gains without any trading required.
How inflation and interest rates affect your bond returns
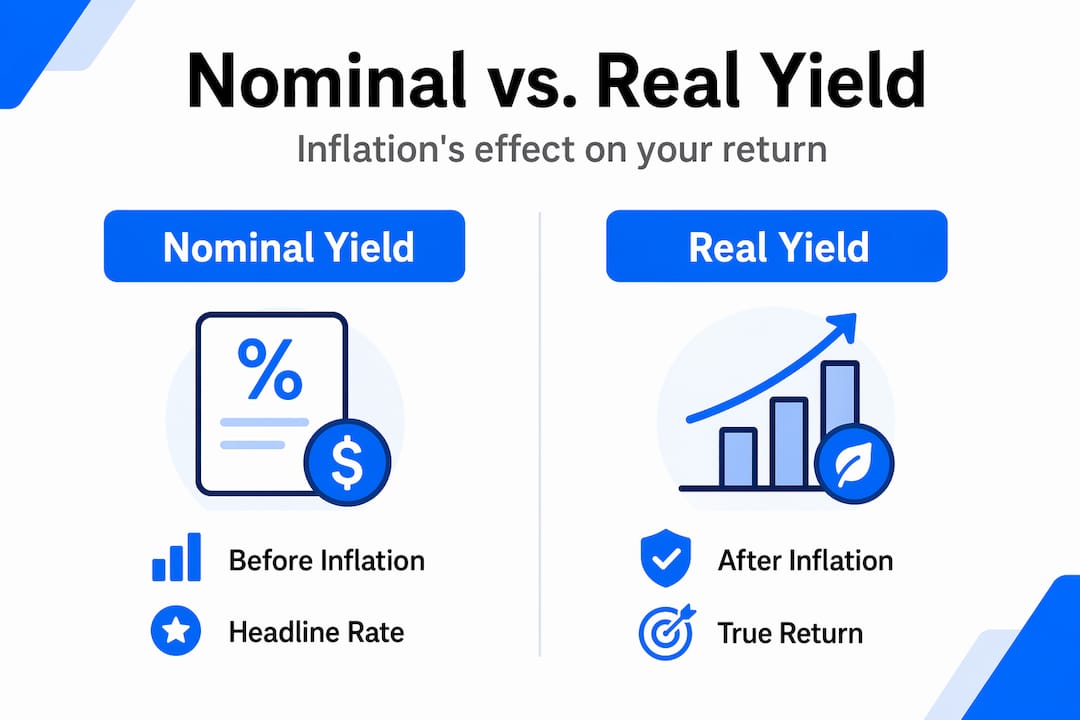
Inflation is the quiet killer for fixed-rate bondholders. When you collect a $50 coupon, inflation determines how much that $50 actually buys. If inflation runs at 4% and your nominal yield is 4.5%, your real return is roughly 0.5%. That’s barely worth the risk. This is why inflation erodes coupon value in ways that nominal yield numbers don’t immediately reveal.
Real yield equals nominal yield minus inflation expectations. It’s the honest number. And nominal yields can spike sharply with rising inflation expectations while real yields stay flat or even decline, which confuses investors who treat nominal yield increases as unambiguously good news.
Central bank policy amplifies all of this. When the Federal Reserve raises rates to fight inflation, bond yields rise and existing bond prices fall. The impact of bond yields extends well beyond fixed income: rising Treasury yields push up mortgage rates, corporate borrowing costs, and consumer loan rates. For context on how this ripple effect works in practice, the tug of war between inflation and growth in current bond markets shows exactly how competing forces create volatile yield conditions.
Here’s what to monitor actively when building a bond portfolio:
- Fed policy meetings: Rate decisions directly move short-term yields, with ripple effects across the curve.
- CPI and PCE inflation data: Rising inflation expectations push nominal yields up and compress real yields.
- Credit spreads: The difference between corporate and Treasury yields signals market stress. Widening spreads mean investors are demanding more compensation for credit risk.
- Duration of your holdings: A bond portfolio’s duration determines how sensitive your holdings are to rate changes. Every 1% rise in rates reduces a 10-year duration portfolio by roughly 10% in market value.
Pro Tip: Treasury Inflation-Protected Securities (TIPS) adjust their principal with inflation, making them a cleaner way to target real yields. If your main concern is purchasing power protection, TIPS outperform nominal bonds during inflationary periods regardless of what the nominal yield looks like.
Knowing how to invest in bonds effectively means treating inflation-adjusted returns as the real benchmark, not headline coupon rates or even nominal YTM.
My take on bond yields for individual investors
I’ve watched individual investors make the same two mistakes for years. The first is buying bonds purely for the coupon without considering what happens to price if rates move against them. The second is over-reacting to yield curve inversions by exiting bonds entirely, which usually means selling near the wrong time.
What I’ve learned is that bond yields are most useful as an information source before they’re useful as a return source. The shape of the yield curve, the direction of real yields, and the spread between short and long-term rates all tell you something about where the economy is headed. That signal matters even if you never buy a single Treasury bond.
The misconception I find most persistent is that higher yields always mean better bonds. They don’t. A high yield on a corporate bond often reflects elevated default risk. A rising Treasury yield can mean capital losses if you bought at par six months ago. Context is everything.
My real-world advice: match your bond duration to your investment horizon, monitor real yields instead of chasing nominal ones, and treat the yield curve as a free economic forecast. Don’t time it perfectly. Just stay informed.
— Povilas
Deepen your bond knowledge with Finblog
If this breakdown of bond yields explained the concepts you’ve been searching for, there’s more practical analysis waiting for you at Finblog. The team covers everything from current bond market dynamics to inflation’s effect on your portfolio to interest rate strategies for 2026. Whether you’re positioning for rate changes, comparing fixed income options, or trying to understand what the yield curve is telling you right now, Finblog’s articles give you the market context to make better decisions. Bookmark it as your ongoing resource for fixed income education and market updates.
FAQ
What is a bond yield in simple terms?
A bond yield is the return an investor earns on a bond based on its current market price and coupon payments. It changes as the bond’s price changes in the secondary market.
Why do bond prices and yields move in opposite directions?
When interest rates rise, new bonds offer higher coupons, making existing bonds less attractive. Their prices fall to compensate, pushing yields up. The two always move inversely.
What does an inverted yield curve mean?
An inverted yield curve occurs when short-term bond yields exceed long-term yields. It has historically preceded U.S. recessions by approximately 12 to 18 months.
What is the difference between nominal yield and real yield?
Nominal yield is the stated annual return before adjusting for inflation. Real yield subtracts inflation expectations and reflects your actual purchasing power gain from holding the bond.
How do rising interest rates affect bond investors?
When rates rise, existing bond prices fall. Investors holding longer-duration bonds face larger price declines. Those who hold to maturity avoid realized losses but miss out on higher-yielding new issuances.