- The S&P500 declined -1.42% in February (still up +1.2% YTD).
- Consumer + Wall Street expectations are rolling over off the highs.
- The spike in policy uncertainty + bearishness may help the market bounce.
- Foreign flows have helped blow a “US Exceptionalism Bubble”.
- Despite the selloff, US stockmarket valuations remain dangerously high.
Overall, there’s plenty of short-term indicators (e.g. surge in bearish sentiment) that make it easy for the market to bounce. But a rising body of more longer-term/cyclical bearish evidence looms. It’s a dangerous point in the cycle, with an uncharted policy backdrop, and hence the mood is steadily shifting…
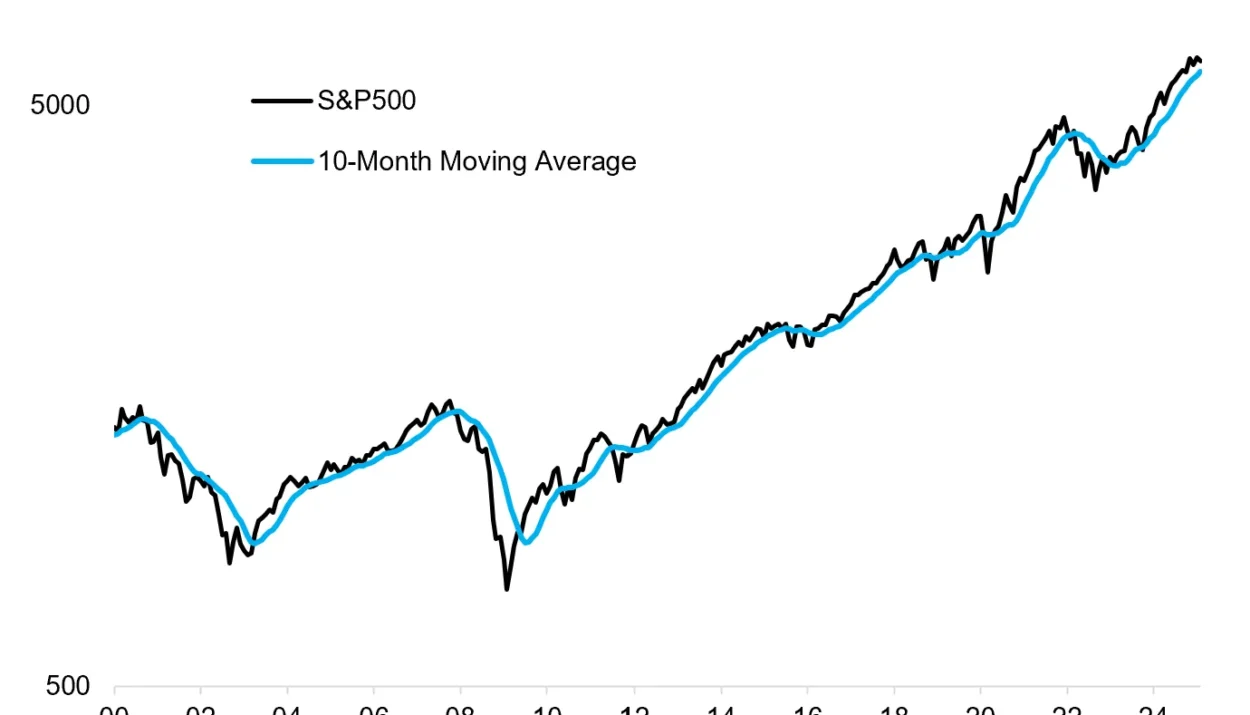
1. Happy New Month… The S&P500 declined -1.42% on the month (with the equal-weighted S&P500 only dropping -0.77%, while the Nasdaq dropped -2.7%). The index is still up +1.2% YTD, but looking over the monthly closes there is a bit of a pattern emerging of one step forward, one step back as the index transitions from strong bull market to more of a volatile and ranging market.
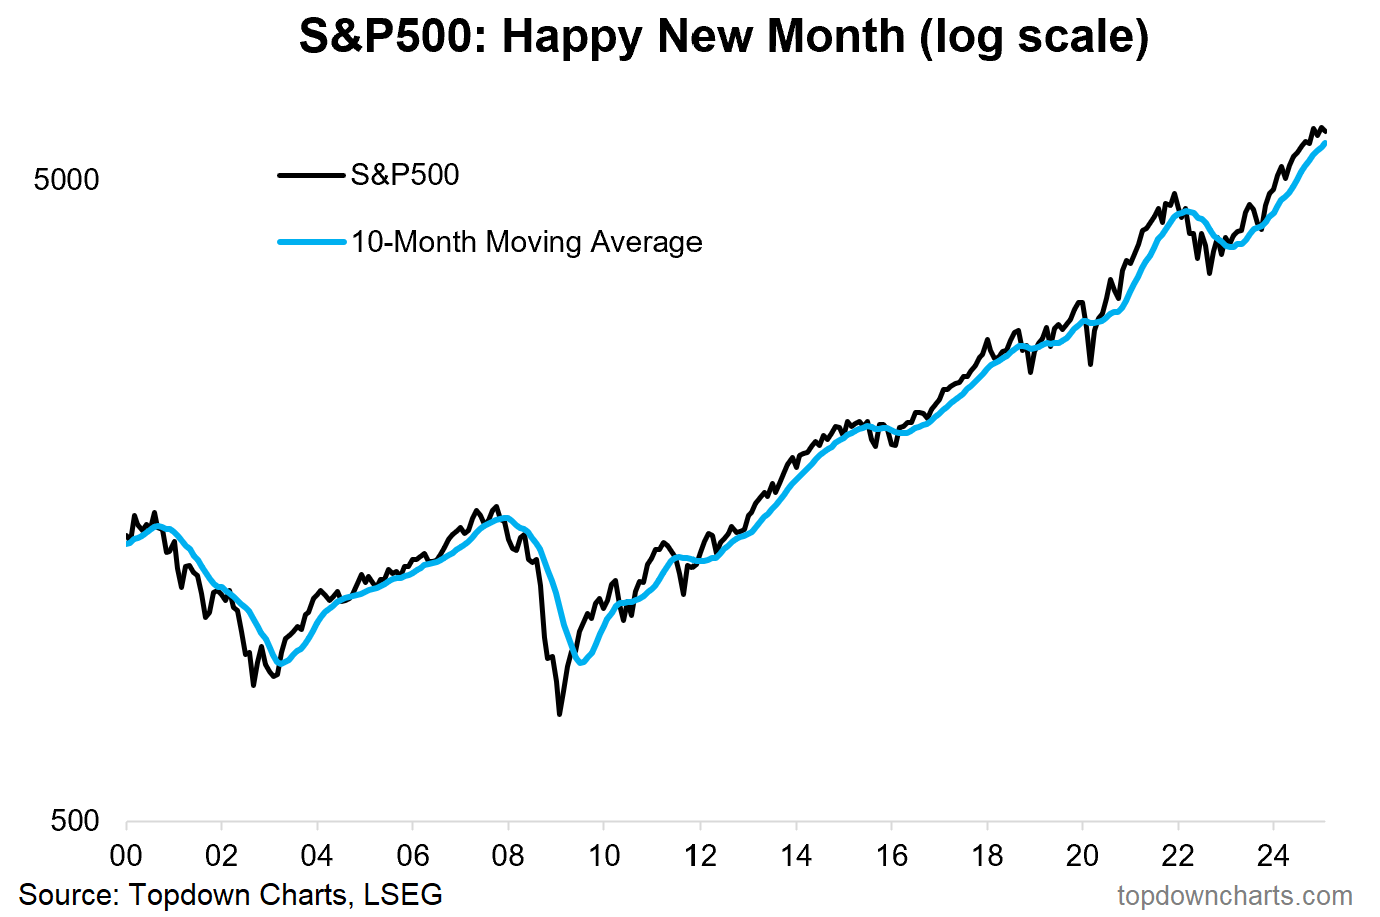
Source: Topdown Charts
2. Consumer Expectations: That theme is being echoed in the Conference Board consumer confidence survey, with stockmarket expectations pulling back further (to a 1-year low) from the November peak.
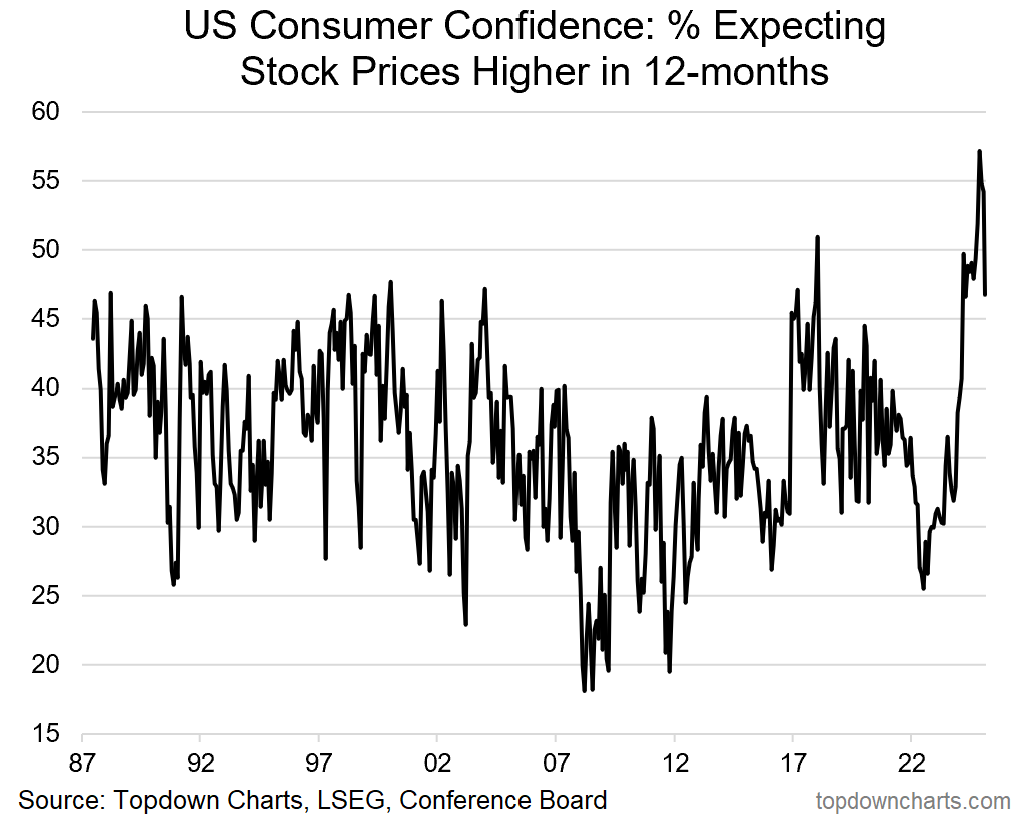
Source: Topdown Charts
3. Curbing Enthusiasm: That trend in turn is echoed or confirmed in my Euphoriameter indicator, which after reaching an all-time high in November has dropped to a 6-month low; and presents a concerning recuring pattern of sentiment and cycle indicators rolling over from previous strong readings.
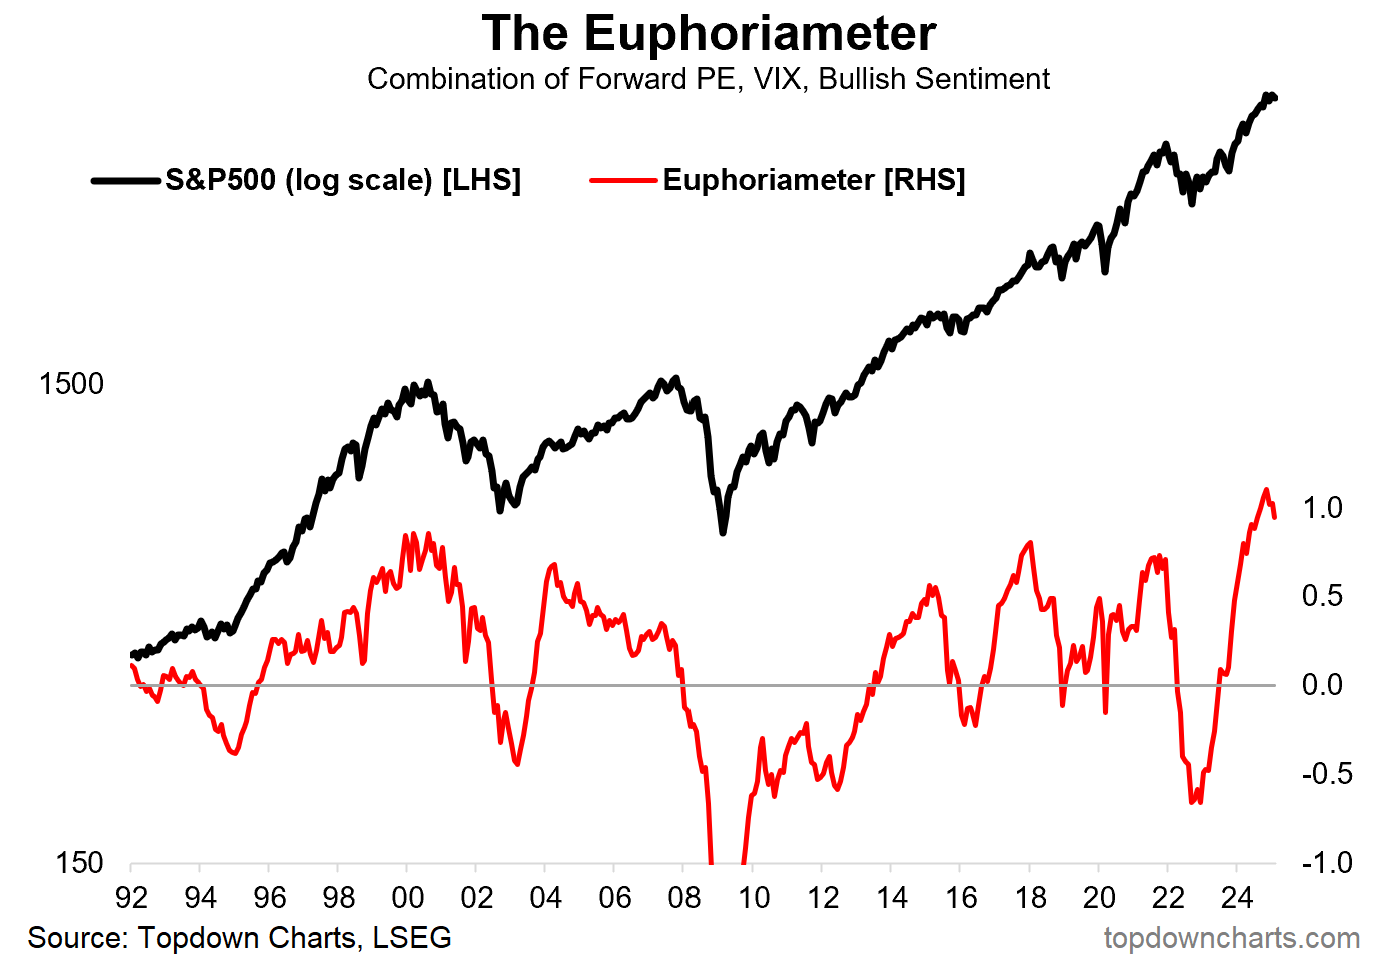
Source: The Euphoriameter
4. Earnings Euphoria: Another angle on it is the I/B/E/S consensus long-term average earnings growth estimates, which have likewise rolled over from levels not too far off that seen around the peak of the dot com bubble.
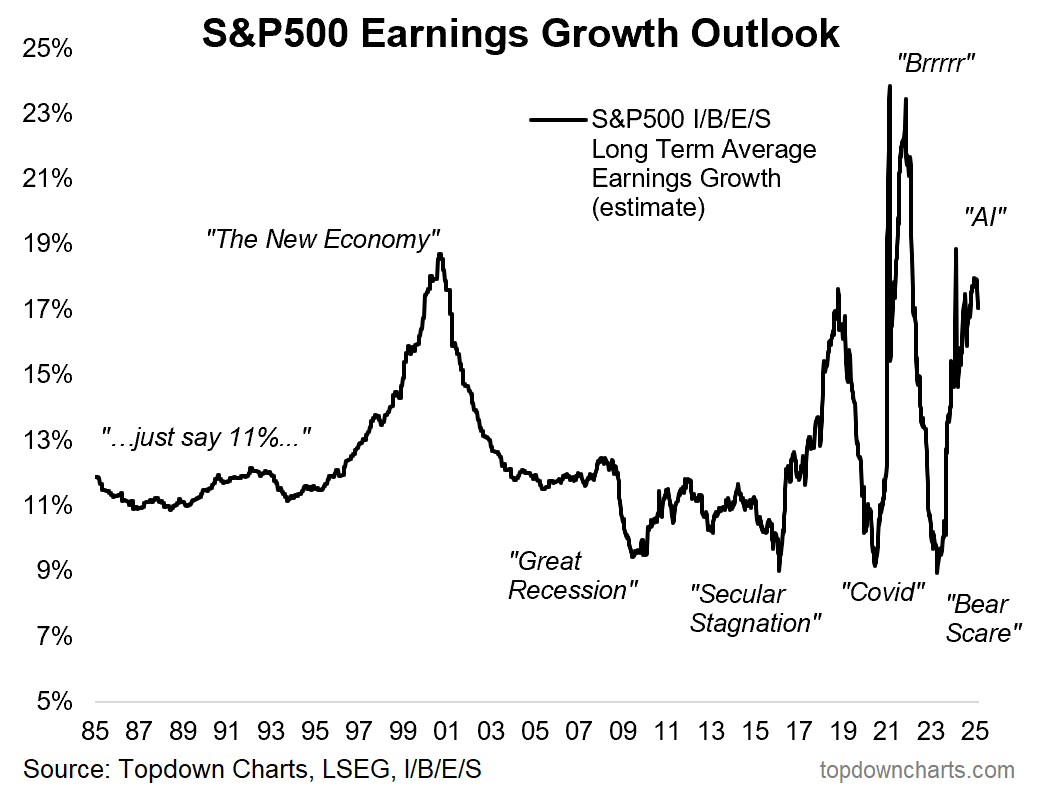
Source: Topdown Charts
5. Surveyed Sentiment: However, in the short-term sentiment has become very bearish very quickly, and while you can see this during the early stages of a larger selloff or downturn (e.g. what we saw heading into 08, 22), it probably wouldn’t take much to get a bounce from here.
One other thing I’d note on this: while the S&P500 only dropped about ~5%, Small Caps have dropped over -12% off the highs, Mag 7 stocks are down an average ~15% off the highs, and some of the more speculative “assets” are down deep double digits (e.g. MicroStrategy -50%, Fartcoin -90%).
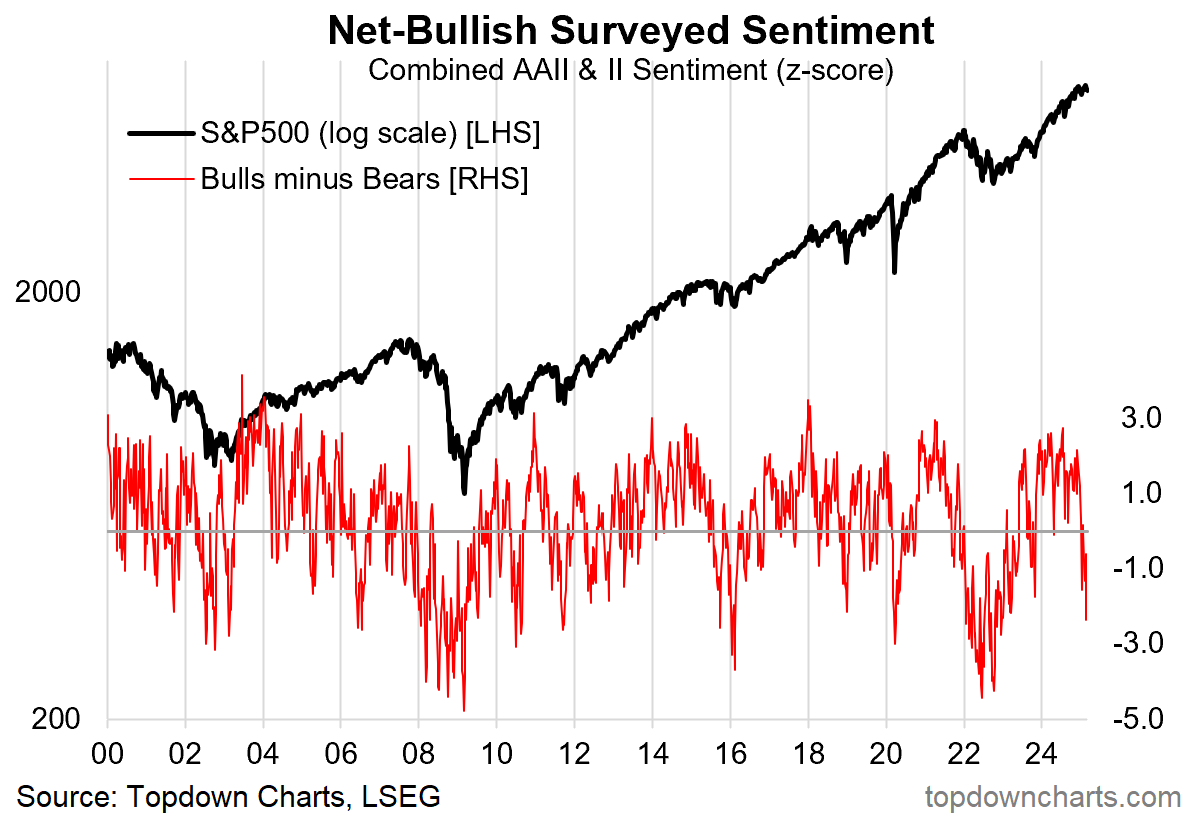
Source: Topdown Charts
6. Policy Uncertainty: Also on that note, RenMac has a bullish take on the surge in policy uncertainty; they point out 90th percentile readings (like now) tended to result in positive subsequent 3-month returns (albeit note that some of these occurred on the way down e.g. in the early 2000’s).
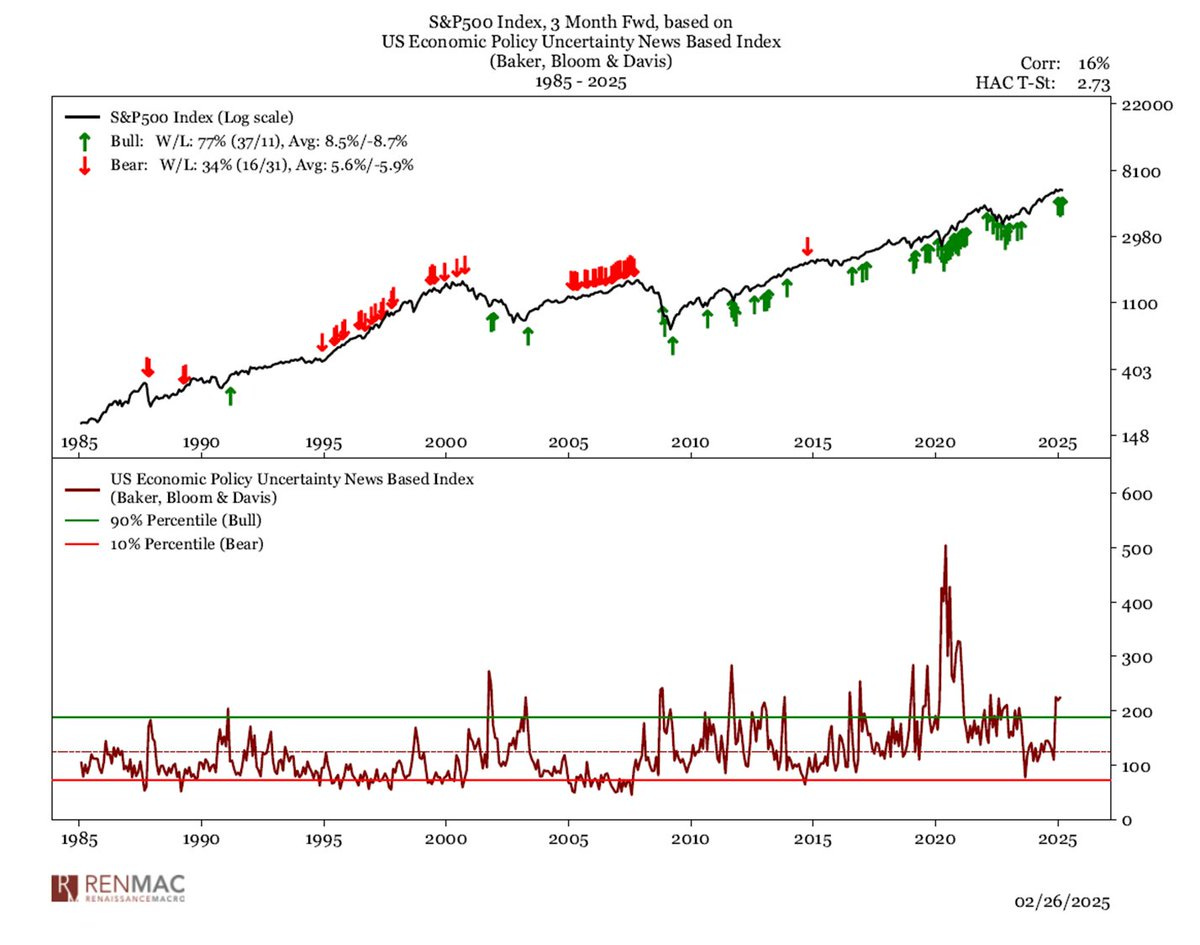
Source: @RenMacLLC
7. Where’s the Risk Premium? On the other hand, the current level of policy uncertainty (and it is very real, we are in very unusual territory here with tariff risk, government reforms and fiscal contraction, geopolitical shifts, and a frenzied pace of activity and announcements by the new admin… there is a real uplift in uncertainty and greater volatility) — Normally the way these two lines travel you’d want to see an Equity Risk Premium at least twice that of the current. You can get that by either dropping the 10-year yield to about 2% or by chopping stockmarket valuations in half… or some combination thereof (neither good!)
Oh and for completeness, since that ERP has long-term inflation in it too, you could also get there via a 20% increase in CPI [also not good, and also likely to do bad things to bond yields and stocks!]
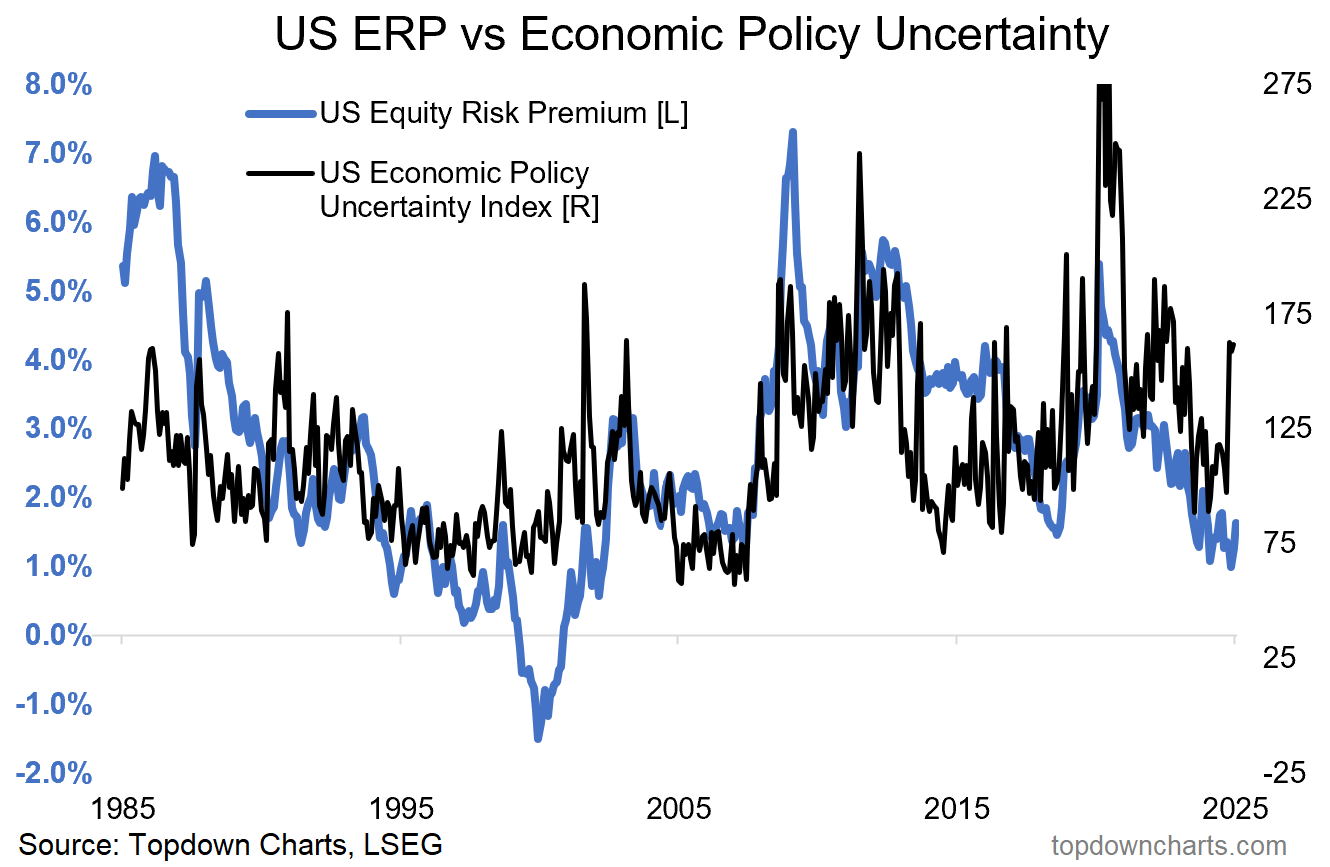
Source: Topdown Charts Professional
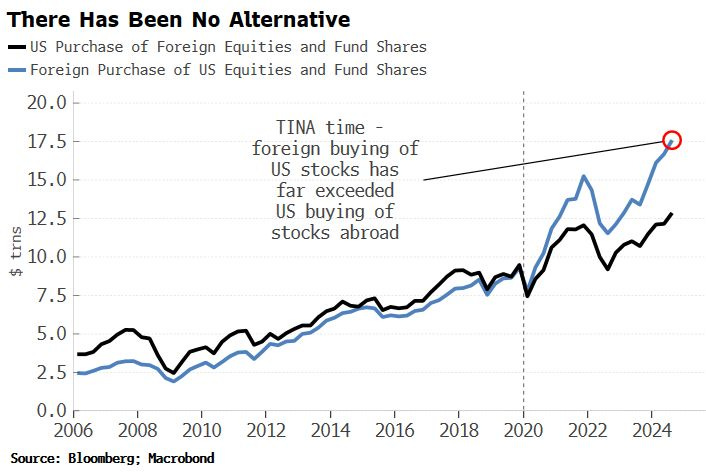
8. Global Flows — Strength or Threat? Foreign purchases of US equities has far exceeded domestic buying, if that goes away or even worse begins to reverse, that will have huge ramifications for market valuations.
How or why would it do that? Some kind of loss of confidence, US economic downturn, unintended effects of tariffs and other America first initiatives, emergence of better returns elsewhere (and on that note, foreign asset prices are generally cheap, and certainly cheaper than US). So it could happen.
Source: Simon White
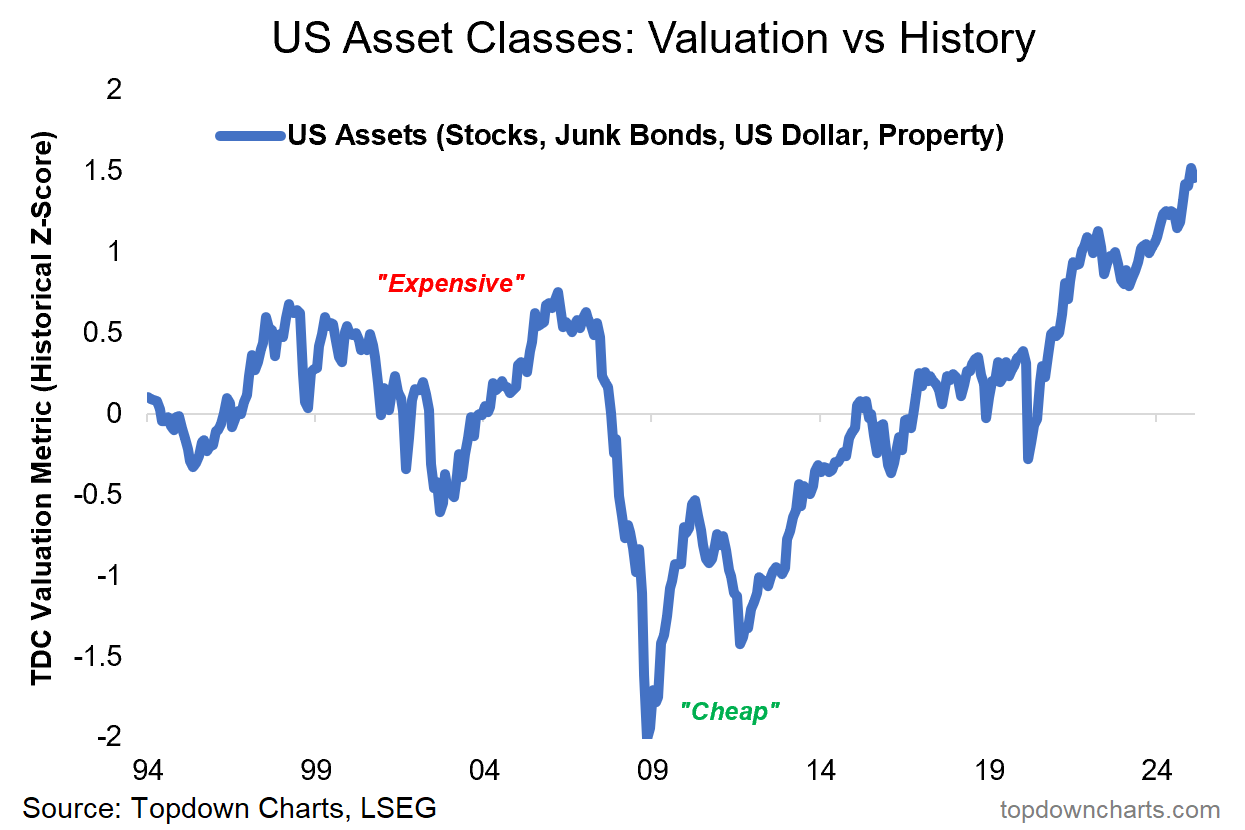
9. US Exceptionalism Bubble: That foreign flows chart looks very familiar with the next one. The chart tracks the combined valuation signal for the US stockmarket, US credit spreads inverted, US dollar, and US housing market. No doubt foreign flows have helped reinforce and exaggerate the fantastic voyage from the depths of 09 to the peak in January this year… and again if flows were to reverse that would be dangerous coming from such lofty heights.
As an investor you tend to have more fun starting from below the line rather than starting from high above the line in this chart. Just saying.
Source: 10 Charts to Watch in 2025
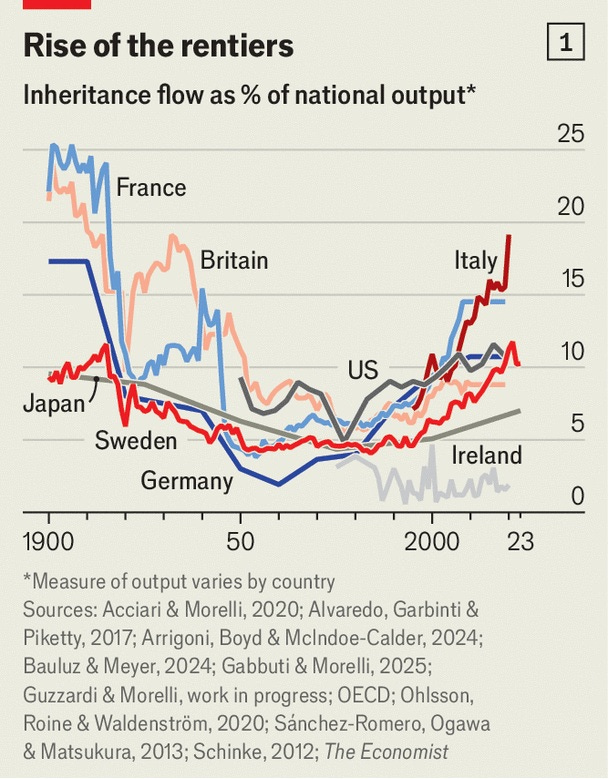
10. The Inheritance Economy: Thanks in part to generally higher asset prices, we’re seeing a clear uptrend and multi-decades high in inheritance flows as a proportion of national output.
Source: Steve Rattner
US Stockmarket Valuations: this indicator tracks a composite of absolute valuations, relative valuations (stocks vs bonds), and mean/trend reversion factors. It is one of the most reliable combinations of the most reliable valuation indicators I have managed to pull together to date. So it is worth giving some weight to.
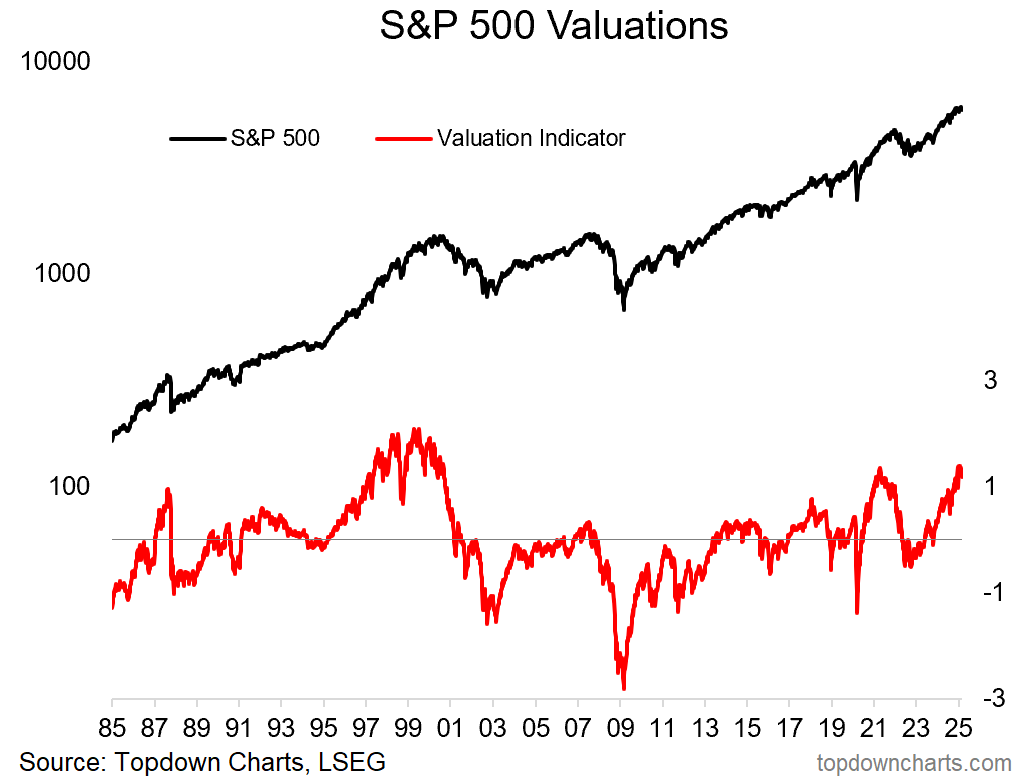
After giving a buy signal back in October 2022, this indicator has since gone on to eclipse the 1987 and 2021 peaks, and only is outshone by the dot com bubble.
In other words, we are in objectively, quantitatively risky territory here. So when you see a bunch of indicators like those documented this week rolling over it means it’s time to really think about getting defensive, diversifying the diversifiers, and how much the prospect of missing out on potential further gains vs the prospect of large downsides affects your psyche and your position in life.
This article was written by Callum Thomas.
Disclosure: This article does not represent investment advice. The content and materials featured on this page are for educational purposes only.
Related:
ETF Inflows at Record Highs – A Bullish Signal or a Bubble?
Which Stocks Super Investors Bought Recently?
How long can NVIDIA stay untouchable?
Trump Organization Files Trademark for Metaverse & NFT Trading Platform
Trade war is back: After new tariffs S&P 500 erased $500+ BILLION of market cap, Bitcoin dropped
Trump vows March 4 tariffs for Mexico, Canada, extra 10% for China over fentanyl
How Trump’s 25% EU Tariffs Could Impact the Stock Market & Key Sectors
How Will Tesla Be Affected by 25% EU Tariffs?
Trump vows to slap 25% tariffs on EU and claims bloc was ‘formed to screw US