


TL;DR:
- Investors often mistake two negative GDP quarters as the start of a recession, but this is misleading. Recognizing the multi-dimensional signals from various economic indicators helps distinguish cycle phases and enables better portfolio timing. Combining leading, coincident, and lagging data improves real-time cycle analysis and strategic decision-making.
Most investors assume a recession begins the moment two consecutive quarters of negative GDP growth appear in the headlines. That assumption is wrong, and acting on it can cost you. Economic cycle stages, formally studied as business cycle stages in macroeconomics, involve a far richer set of signals: GDP, employment, income, consumer spending, and industrial output. Understanding how each phase works, and more importantly, how to recognize one in real time, separates reactive investors from strategic ones.
Key takeaways
| Point | Details |
|---|---|
| Four distinct cycle stages | Expansion, peak, contraction, and trough each carry unique indicator patterns that affect investment conditions. |
| Recession is multidimensional | The NBER uses broad economic criteria, not just GDP, to officially date recessions and recoveries. |
| Leading indicators come first | The Conference Board LEI signals upcoming cycle shifts before coincident data confirms them. |
| Labor markets lag the cycle | Unemployment trends often move slowly, so they require early monitoring rather than reactive responses. |
| No single metric is enough | Combining leading, coincident, and lagging indicators improves timing accuracy for portfolio decisions. |
The four economic cycle stages and what drives them
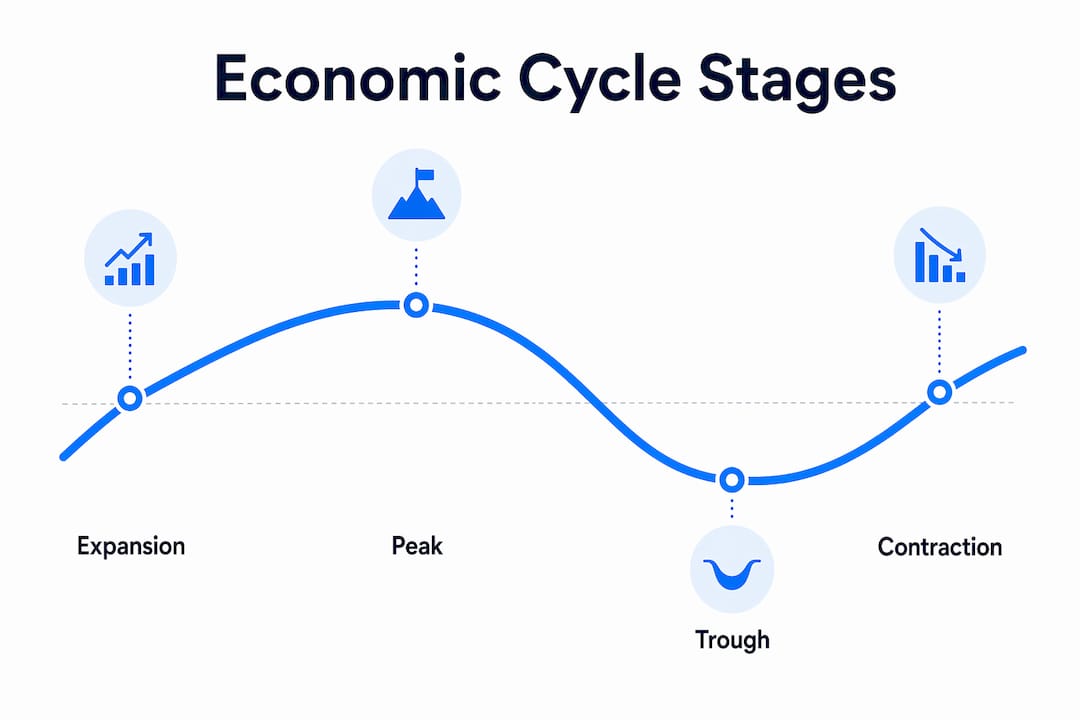
The four core stages of a business cycle are expansion, peak, contraction, and trough. Each stage has a distinct fingerprint across macroeconomic data, and each one creates different conditions for investors.
Expansion
Expansion is the phase most investors love to be in. GDP grows, employment rises, consumer confidence climbs, and interest rates typically remain low enough to encourage borrowing and spending. Corporate earnings tend to beat expectations, and equity markets generally reward investors who positioned themselves early. This is also when credit becomes easier to access, which fuels further spending and investment.

The tricky part is that expansion can last years. Since World War II, the average U.S. expansion has run significantly longer than the average contraction, which means investors who sit out expansions waiting for a recession often miss the bulk of the market’s gains.
Peak
The peak is deceptively quiet. Output reaches its maximum, indicators stop accelerating and begin to plateau, and subtle signs of overheating appear. Inflation often picks up. Labor markets tighten. Interest rates may rise as central banks respond. At the peak, the economy looks great on the surface, but forward-looking data starts flashing caution signals.
Most investors fail to identify the peak until it has already passed. That is partly by design: peaks are only confirmed in retrospect.
Contraction and recession
Contraction is a broad-based decline across multiple economic dimensions, not simply two consecutive quarters of shrinking GDP. Output falls, businesses cut payrolls, consumer spending retreats, and industrial production weakens. A recession, technically speaking, is a contraction severe enough and widespread enough to register across all of these measures simultaneously.
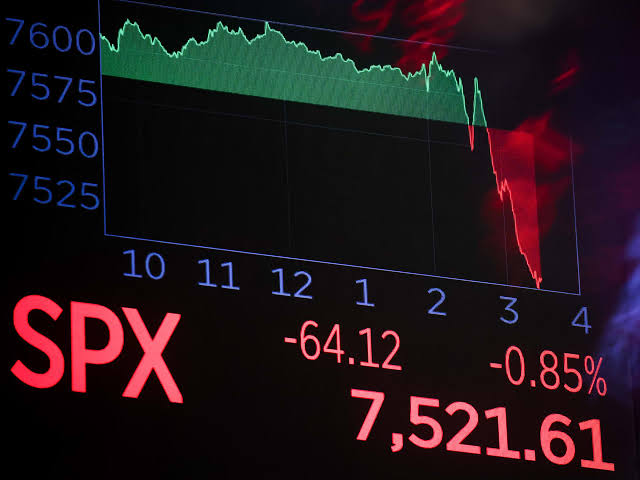
This distinction matters enormously for investors. If you wait for the “official” two-quarter GDP rule before repositioning your portfolio, you are already deep inside the contraction by the time you act.
Trough
The trough is the cycle’s lowest point. Economic activity bottoms out, and conditions begin stabilizing. This is the stage that precedes recovery, though it rarely feels that way in the moment. News flow tends to be its worst at the trough, which is exactly why investors who recognize it early capture the most significant gains in the subsequent expansion.
Pro Tip: The trough is historically the best time to increase equity exposure, but most retail investors do the opposite because sentiment is at its most negative.
Reading the indicators that reveal cycle phases
Knowing the four phases intellectually is one thing. Knowing which phase you are currently in requires a reliable framework for interpreting economic data. This is where leading and coincident indicators become your most practical tools.
| Indicator Type | Examples | When it moves | Best use |
|---|---|---|---|
| Leading | Conference Board LEI, ISM New Orders | Turns before the economy | Forecasting upcoming cycle shifts |
| Coincident | Industrial Production, payroll employment | Moves with the economy | Confirming current phase |
| Lagging | Unemployment rate, commercial loans | Turns after the economy | Validating a phase has ended |
The Conference Board’s LEI is the most widely used composite leading indicator. It aggregates ten forward-looking data points, including manufacturing new orders, building permits, and credit conditions, into a single index designed to signal turning points three to six months before they occur. The Coincident Economic Index (CEI) does the opposite: it tracks current conditions using payroll data, personal income, industrial output, and retail sales.
Using both LEI and CEI together gives you a framework that balances early warning with real-time confirmation. If the LEI starts declining but the CEI still shows expansion, you are likely watching an early warning sign rather than a confirmed turn. When both start moving in the same direction, conviction increases substantially.
The sequence of indicator signals also tends to follow a predictable chronology: ISM Manufacturing New Orders turn first, the LEI follows, and Industrial Production (a coincident measure) turns last. Understanding this chain helps you avoid overreacting to a single data point while still catching meaningful trends early.
Pro Tip: Finblog’s guide on economic indicators for investors breaks down the LEI’s components in plain language, which is worth reading before your next quarterly portfolio review.
How recessions are officially dated and why it matters
Here is where most market commentary gets sloppy. The National Bureau of Economic Research (NBER) is the body that officially dates U.S. recessions. It uses multiple indicators and applies a broad-based criterion requiring significant, sustained decline across the economy. Not just two negative GDP quarters.
The FRED GDP-Based Recession Indicator takes a different, mechanical approach. It flags a recession when the index rises above a 67% threshold and signals the end of a recession when it falls below 33%. This rule-based method enables consistent backtesting and comparison across cycles, but it differs meaningfully from the NBER’s more judgment-driven process.
The practical implication:
- NBER recession dates are authoritative but backward-looking. They are often announced six to twelve months after the recession has begun.
- Mechanical indicators like FRED’s GDP-based tool provide faster flags but can generate false positives.
- Real-time cycle identification is inherently probabilistic. You are always working with incomplete information.
- Indicator confirmation lags mean that by the time a recession is confirmed, portfolio damage may already be done.
- Smart investors treat recession signals as probability shifts, not binary triggers.
The implication for your portfolio is this: do not anchor to any single official definition. Use the NBER framework for historical context, the mechanical indicators for consistent tracking, and the LEI for early warning. None of these tools alone is definitive, but together they paint a much clearer picture of where the cycle stands.
Labor markets and what they reveal about cycle timing
Unemployment data deserves its own spotlight in any discussion of business cycle stages because it behaves differently from GDP and output measures. Labor markets tend to lag the broader cycle, meaning they keep deteriorating after a trough has already been reached and keep improving well into a contraction before unemployment starts rising noticeably.
Post-1988 labor market cycles have lengthened considerably compared to earlier decades.
| Period | Average trough-to-peak duration |
|---|---|
| Pre-1988 cycles | ~18.4 months |
| Post-1988 cycles | ~30 months |
| COVID-19 cycle | ~7 months (shortest on record) |
This structural shift suggests that modern labor markets recover more gradually and are more resilient to short-term shocks, which complicates the task of reading where we are in the cycle at any given moment.
Recent data reinforces this nuance. Unemployment rose roughly one percentage point over a 33-month stretch, a pace slower and less severe than most historical contractions. That kind of gradual deterioration does not look alarming headline by headline, but it represents a meaningful shift in labor market momentum.
Key investor takeaways on labor market monitoring:
- Watch for unemployment troughs (the lowest point before a rise) as an early warning of potential economic softening.
- A slow rise in unemployment does not eliminate the risk of recession. It may simply mean the cycle is moving at a different pace.
- Do not wait for unemployment to spike sharply before adjusting your risk exposure. The lag effect means that by the time unemployment looks alarming, the downturn may already be well established.
- Cross-reference labor data with the LEI and CEI to validate trends rather than relying on payroll numbers alone.
Applying cycle knowledge to your investment strategy
Understanding the phases of the economic cycle only creates value when you translate that knowledge into portfolio decisions. Here is a practical framework for doing exactly that.
-
Track the LEI monthly. A sustained decline of three to four months in the Conference Board LEI, particularly when combined with a flat or weakening CEI, signals that a cycle shift may be approaching. Do not react to a single month’s reading.
-
Cross-reference leading and coincident data. Combining multiple indicators systematically reduces the risk of acting on a false positive. Build a simple tracking dashboard that logs both LEI and CEI readings alongside labor market and manufacturing data.
-
Adjust sector exposure by cycle phase. Expansion phases favor growth-oriented sectors like technology and consumer discretionary. Peak and contraction phases tend to favor defensives: utilities, healthcare, and consumer staples. The trough and early recovery favor cyclicals and financials.
-
Resist the urge to call the turn too early. Most experienced investors have been burned by positioning for a recession that takes longer than expected to materialize. Indicator trends need time to confirm. The risk of acting on lagging indicators is that you delay action until the market has already priced in the cycle shift.
-
Stay flexible. Economic cycles do not follow a fixed timetable. The COVID contraction lasted only about seven months. The 2010s expansion lasted over a decade. Build your strategy around probabilities, not certainties.
Pro Tip: Finblog’s article on stock market trends pairs well with this framework by showing how cycle stage awareness maps to actual market behavior patterns.
For investors who want additional indicator tools, the trading indicators checklist from Tradesoft offers a practical reference for pairing macroeconomic cycle data with technical market signals.
My perspective on navigating the cycle
I have spent years watching investors make the same mistake: they wait for certainty before acting, and certainty never arrives. The NBER will tell you a recession started eight months ago. The headlines will confirm what the data already signaled. By then, the opportunity to reposition has closed.
What I have learned is that the most useful thing economic cycle analysis gives you is not a definitive answer. It gives you a probability framework. When the LEI is declining for three consecutive months, unemployment is creeping up, and manufacturing orders are softening, you do not need an official NBER announcement to start tilting your portfolio more defensively. The weight of the evidence is enough.
The conventional recession definition, the two-quarter GDP rule, is the kind of shortcut that sounds sensible but misleads in practice. I have seen investors hold fully aggressive positions because GDP was still technically positive, while every other indicator in their own dashboard was flashing yellow. That is the danger of anchoring to a single mechanical measure.
My genuine advice is this: treat economic cycles as a living system, not a checklist. The data is noisy, the stages bleed into each other, and the timing is never clean. But if you watch the right indicators, in the right sequence, with appropriate humility about what you do not yet know, you will consistently position yourself better than the majority of market participants who are waiting for the obvious signal everyone else can already see.
— Povilas
Deepen your market cycle knowledge with Finblog
If this guide sparked questions about how to put economic cycle analysis into a real investment workflow, Finblog has the resources to take you further. The site covers macroeconomic frameworks, indicator-driven strategies, and market forecasting tools designed specifically for investors who want to stay ahead of cycle turns rather than react to them.
Explore Finblog’s full library at finblog.com to find in-depth articles on reading economic indicators, building cycle-aware portfolios, and understanding the structural forces shaping today’s market conditions. Whether you are refining an existing strategy or building one from scratch, the content is built for serious investors who want more than surface-level analysis.
FAQ
What are the four economic cycle stages?
The four stages are expansion, peak, contraction, and trough. Each phase is defined by distinct patterns in GDP, employment, consumer spending, and industrial output.
How does the NBER define a recession?
The NBER uses multiple indicators to date recessions, requiring broad-based declines across output, employment, income, and sales. Two consecutive quarters of negative GDP growth alone do not constitute the official definition.
What is the difference between leading and coincident indicators?
Leading indicators, like the Conference Board LEI, turn before the economy shifts, making them useful for forecasting. Coincident indicators, like industrial production, move with the current economy and confirm what is happening right now.
How long does an average economic cycle last?
Cycle duration varies considerably. Post-1988 labor market expansions have averaged around 30 months, though the COVID contraction lasted only about seven months, making historical averages a loose guide at best.
Can investors reliably time the economic cycle in real time?
No investor can time cycles with certainty because real-time identification is probabilistic. The best approach uses multiple indicator types together and treats signals as shifting probabilities rather than definitive cycle phase declarations.