
TL;DR:
- Economic cycles consist of four stages—expansion, peak, contraction, and trough—that influence economic indicators and investment strategies. Recognizing these phases through multiple signals helps investors and career planners adjust risk and opportunities proactively rather than reacting to delayed official recession calls. Maintaining a nuanced, multi-indicator approach allows for more effective decision-making amid the cycle’s inherent unpredictability.
An economic cycle is the recurring sequence of expansion and contraction in an economy that shapes GDP growth, employment levels, and investment returns. Understanding economic cycles explained simply means recognizing four distinct stages: expansion, peak, contraction, and trough. The National Bureau of Economic Research (NBER) officially dates these cycles using GDP, income, employment, and consumer spending data. Whether you are planning a career move, rebalancing a portfolio, or building financial literacy, knowing where the economy stands in its cycle is one of the most practical tools available to you.
What are the four stages of the economic cycle?
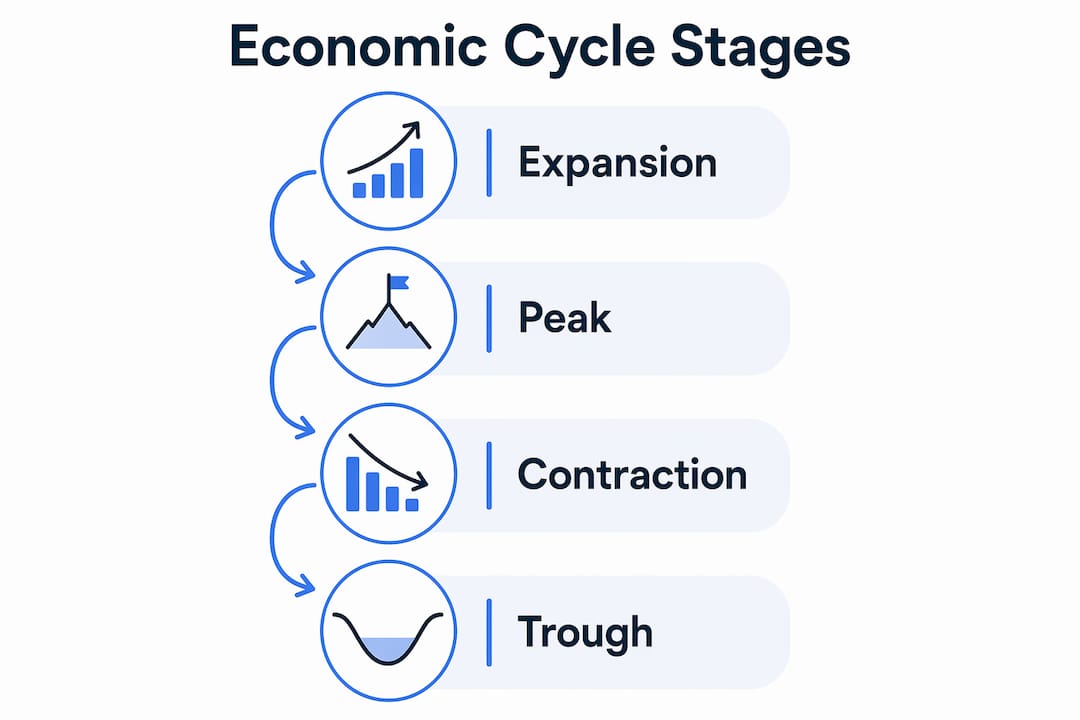
Economic cycles consist of four stages that repeat in sequence, though never on a fixed schedule. Each stage carries distinct signals in the data and distinct implications for your money.
| Stage | Key Characteristics |
|---|---|
| Expansion | Rising GDP, falling unemployment, growing consumer spending, low interest rates |
| Peak | Maximum output, rising inflation pressure, credit tightening, imbalances forming |
| Contraction | Declining GDP, rising unemployment, reduced spending, tightening credit |
| Trough | Minimum output, stabilizing conditions, early recovery signals emerging |
Expansion is the phase most people recognize as a “good economy.” GDP grows quarter over quarter, businesses hire, wages rise, and consumer confidence climbs. The Federal Reserve typically keeps interest rates low early in an expansion to encourage borrowing and investment. This is the phase where equity markets tend to perform best and cyclical sectors like technology and consumer discretionary lead.
Peak is the inflection point where growth stops accelerating. Output is at its highest, but imbalances accumulate. Inflation often rises as demand outpaces supply, and central banks respond by raising rates. The 2022 peak in the U.S. cycle is a clear example: the Fed raised the federal funds rate from near zero to over 5% in roughly 18 months, signaling that the expansion had run its course.
Contraction begins when GDP declines. A recession is technically defined as two consecutive quarters of negative GDP growth, though the NBER uses a broader set of criteria including severity and diffusion across sectors. During contraction, corporate earnings fall, layoffs rise, and consumer spending pulls back. Bond markets often outperform equities in this phase as investors seek safety.
Trough is the bottom of the cycle. It is not a moment of celebration in real time. It only becomes identifiable in retrospect, once recovery indicators begin to confirm a turn. Since 1950, the average U.S. cycle has lasted roughly five and a half years, but individual cycles have ranged from under two years to over a decade.
Pro Tip: Do not wait for official confirmation of a trough before acting. By the time the NBER declares a recession ended, equity markets have often already recovered 20% or more from their lows.
How do economic indicators reveal the current cycle phase?
Knowing the four business cycle phases is only useful if you can identify which one you are in. That requires reading economic indicators, which fall into three categories.
- Leading indicators move before the economy turns. The yield curve, building permits, the ISM Manufacturing New Orders Index, and stock market performance all signal future direction. An inverted yield curve, where short-term Treasury rates exceed long-term rates, has preceded every U.S. recession since 1955.
- Coincident indicators move with the economy in real time. GDP, industrial production, and personal income are the primary examples. These confirm the current state but do not predict the next turn.
- Lagging indicators confirm trends after they are established. Unemployment is the most watched lagging indicator. Unemployment lags GDP changes by several months, meaning job losses often peak well after a recession has technically begun.
The practical implication of this lag is significant. If you wait for unemployment to spike before adjusting your portfolio or career strategy, you are already deep inside a contraction. Unemployment is a confirmation metric, not a warning signal.
The NBER’s recession dating committee uses GDP, real income, employment, and wholesale-retail sales together to date cycle turning points. No single number drives the call. This multi-indicator approach is the right model for individual investors and career planners too.
Pro Tip: Track the Conference Board’s Leading Economic Index alongside the ISM Services PMI each month. Together, they give you a faster read on cycle direction than any single government report.

The best practice for analyzing economic cycles is to triangulate across leading, coincident, and lagging indicators rather than relying on one metric. This reduces the risk of false signals and gives you a more accurate picture of where the cycle actually stands.
Why economic cycles matter for your investments and career
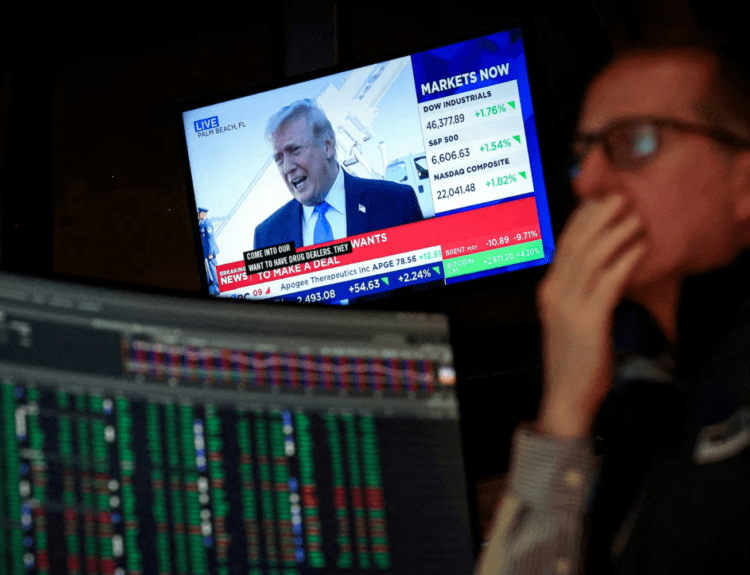
The impact of economic cycles on financial markets is direct and measurable. Equities broadly rise during expansion and fall during contraction, but the relationship is more nuanced than that simple rule suggests.
Supply shocks and demand shocks produce different cycle effects on asset classes. A demand-driven expansion, like the post-2009 recovery, lifts equities and real estate broadly. A supply shock, like the 2021 to 2022 commodity surge driven by pandemic disruptions and the war in Ukraine, creates inflation that erodes bond values and pressures growth stocks even while some sectors benefit. The type of shock driving a cycle determines which asset classes benefit and which suffer. Understanding this distinction separates reactive investors from strategic ones.
For career planning, the cycle stage at the time you enter or exit a job market matters enormously. Expansions create hiring surges and wage growth. Contractions produce layoffs concentrated in cyclical industries like construction, manufacturing, and finance. Counter-cyclical sectors including healthcare, utilities, and government employment tend to hold steadier through downturns.
Business cycle fluctuations impose a measurable cost on consumer welfare and consumption certainty. This cost is countercyclical, meaning it rises precisely when economic conditions are worst and households can least afford the uncertainty. For investors, this translates directly into portfolio risk that compounds during contractions.
Here is what cycle awareness changes in practice:
- During expansion, increase equity exposure toward cyclical sectors and consider rising interest rate strategies as the peak approaches.
- During peak, reduce duration in bond portfolios and trim overweight positions in high-growth equities.
- During contraction, shift toward defensive equities, short-duration bonds, and cash. Review career sector exposure and build emergency reserves.
- During trough, begin rebuilding equity positions before official recovery confirmation arrives.
The investors who consistently outperform over full cycles are not the ones who predict recessions perfectly. They are the ones who adjust positioning incrementally as indicators shift, rather than reacting to headlines after the fact.
What are the most common misconceptions about economic cycles?
Several persistent myths make economic cycle analysis harder than it needs to be. Clearing them up makes the whole framework more useful.
Myth 1: Cycles follow a fixed schedule. The five-and-a-half-year average since 1950 is a statistical summary, not a clock. The expansion from 2009 to 2020 lasted 128 months, the longest on record. The COVID-19 contraction of 2020 lasted just two months, the shortest ever recorded. Treating cycles as predictable pendulums leads to premature repositioning and missed gains.
Myth 2: Two negative GDP quarters always mean recession. This mechanical definition is widely cited but not what the NBER uses. GDP-based recession indicator models identify recession periods when specific index thresholds are crossed, offering an objective alternative to committee judgment. The NBER’s broader criteria include severity, diffusion across sectors, and duration. The first half of 2022 saw two negative GDP quarters, but the NBER did not declare a recession because employment and income data remained strong.
Myth 3: You will know a recession when it starts. Official recession calls are determined after the fact, often six to eighteen months after the cycle peak. FRED’s recession shading series uses multiple methodological conventions including midpoint, trough, and peak dating methods, and these can produce different interpretations of the same data. Practitioners use the momentum of leading indicators to make real-time decisions, not official declarations.
Myth 4: Recent cycles behave like historical ones. The COVID-19 cycle defied every historical pattern. A two-month recession followed by the fastest labor market recovery in U.S. history, combined with supply chain disruptions and fiscal stimulus at unprecedented scale, produced an inflation surge that traditional cycle models did not anticipate. Flexible strategy beats rigid adherence to historical averages.
Key takeaways
Understanding economic cycles requires tracking multiple indicators simultaneously, not waiting for official recession declarations that arrive months after the fact.
| Point | Details |
|---|---|
| Four stages define every cycle | Expansion, peak, contraction, and trough each carry distinct signals for investors and career planners. |
| Unemployment is a lagging signal | Job losses confirm a recession is underway; they do not predict one, so act on leading indicators first. |
| Cycle length is unpredictable | U.S. cycles since 1950 average five and a half years but range from two months to over a decade. |
| Shock type changes asset behavior | Demand shocks and supply shocks produce different effects on equities, bonds, and commodities. |
| Triangulate across indicator types | Leading, coincident, and lagging indicators together give a more reliable cycle read than any single metric. |
Cycles are messier than the textbook version
I have spent years watching investors and professionals treat economic cycles like a reliable calendar. They read that the average expansion lasts five years, count forward from the last trough, and start repositioning accordingly. That approach has cost people real money.
What I have found actually works is treating cycle analysis as a weight-of-evidence exercise. No single indicator, not the yield curve, not the ISM, not unemployment, tells the full story. The 2019 yield curve inversion predicted a recession that arrived in 2020, but for entirely different reasons than the inversion suggested. The 2022 GDP contraction looked like a recession on paper but was not one by any meaningful employment measure.
The practical lesson I keep coming back to is this: use cycles to set your direction, not your timing. If leading indicators are deteriorating across the board, reduce risk gradually. Do not wait for confirmation. Do not try to call the exact peak. The cost of being early is small. The cost of being late, as the welfare cost of cycle fluctuations research confirms, is substantial and hits hardest when you can least absorb it.
For career planning, the same logic applies. If you are in a cyclical industry and leading indicators are turning, that is the time to update your resume and build savings. Not when the layoffs start. The people who navigate downturns best are the ones who prepared during the expansion, not the ones who reacted to the contraction.
— Povilas
How Finblog helps you stay ahead of the cycle
Finblog publishes in-depth analysis on economic indicators, investment strategy, and market conditions designed for investors who want more than headlines. If this overview of economic cycles explained the framework, the next step is learning how to apply it in real time. Finblog’s guide on economic indicators for investors walks through exactly which signals to track and how to interpret them. For a deeper look at how cycle phases translate into portfolio decisions, the economic cycle stages guide covers sector rotation, risk management, and timing frameworks. Start building your cycle-aware strategy at Finblog.
FAQ
What are the four stages of the business cycle?
The four business cycle phases are expansion, peak, contraction, and trough. Each stage is defined by distinct movements in GDP, employment, and consumer spending.
How does the NBER define a recession?
The NBER uses a committee to date recessions based on GDP, real income, employment, and sales data, considering severity, diffusion, and duration rather than applying a simple two-quarter GDP rule.
Why is unemployment a lagging indicator?
Unemployment lags GDP changes by several months because businesses delay hiring and firing decisions until economic trends are clearly established. It confirms a recession is underway rather than predicting one.
How long does an average economic cycle last?
Since 1950, the average U.S. economic cycle has lasted approximately five and a half years, but individual cycles range from two months to over ten years depending on the forces driving them.
How should investors use economic cycle analysis?
Investors use leading indicators like the yield curve and ISM indices to identify cycle turning points early, then adjust sector exposure and asset allocation gradually rather than reacting to official recession declarations after the fact.