U.S. stocks are approaching all-time highs, fueled by expectations of interest rate cuts from the Federal Reserve. The third volume of the Yahoo Finance Chartbook reveals widespread optimism among investors and economists about the economy’s ability to achieve a “soft landing” post rate hikes. Despite risks like the upcoming presidential election and potential economic slowdown, the S&P 500 has surged nearly 17% this year, and experts foresee continued growth, especially with AI enthusiasm driving market rotations.
In three parts of this news, we will present 32 charts from the Yahoo Finance Chartbook that tell the story of the markets and the economy midway through 2024.
INFLATION CONTINUES SLOW DESCENT
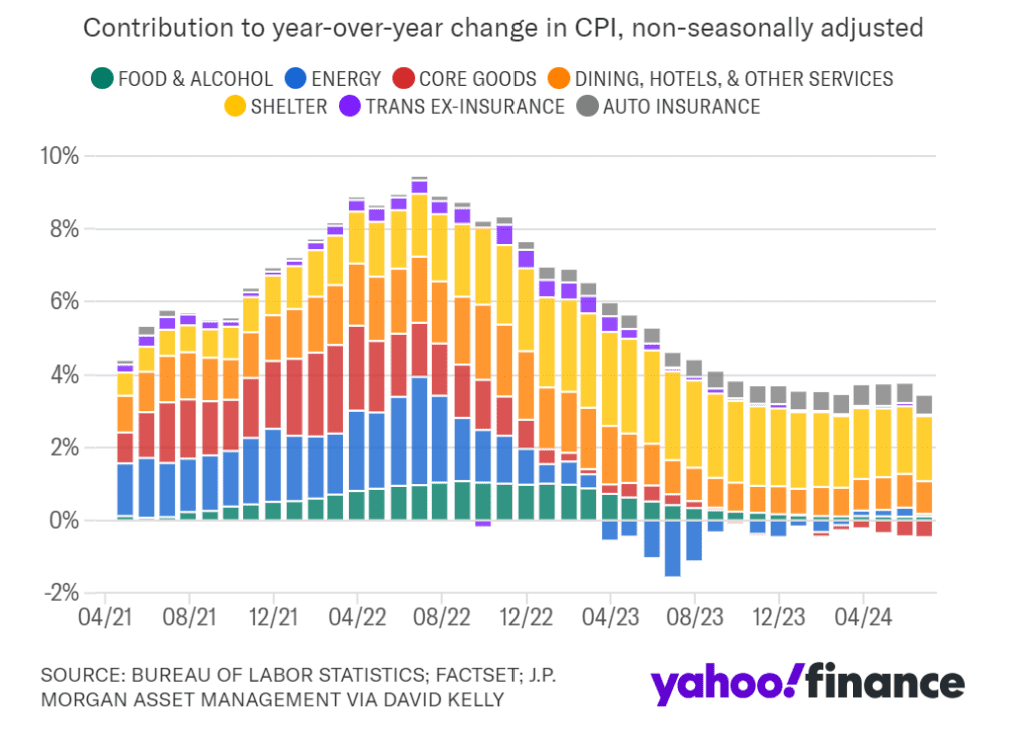
Inflation in the first quarter dashed hopes for aggressive policy easing but has since shown signs of easing, with June’s headline inflation at 3.0% year-over-year, down from 3.5% in March. While food and energy prices have stabilized, gains in shelter and auto insurance remain high. However, real-time data indicates easing price pressures, potentially bringing inflation to 2% by mid-next year. If this trend continues, the Federal Reserve may cut rates twice this year, starting in September.
LABOR MARKET AT AN ‘INFLECTION POINT’
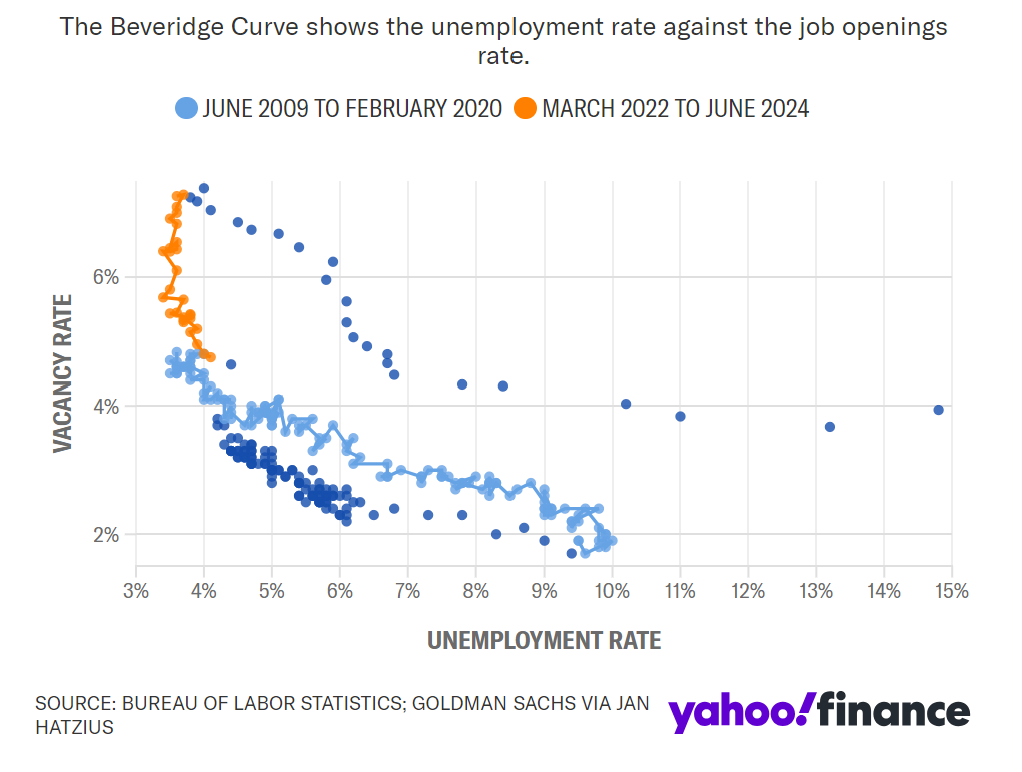
The US labour market has seen a significant drop in job openings and minimal unemployment increase. This trend may soon lead to a larger rise in unemployment as labour demand softens.
RENT RETURNING TO PRE-PANDEMIC LEVELS
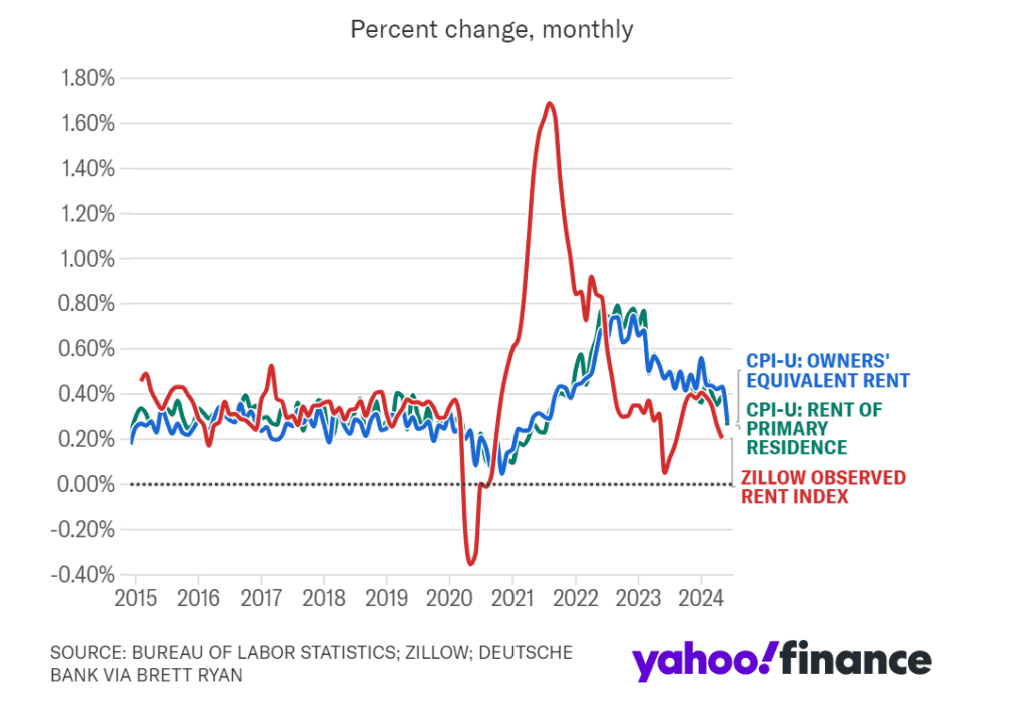
A significant drop in primary and owners’ equivalent rents in the latest CPI data boosts confidence in inflation’s trajectory towards 2%. Persistent changes in rental inflation typically indicate longer-lasting trends.
‘HARMONIZED’ INFLATION BELOW THE FED’S TARGET
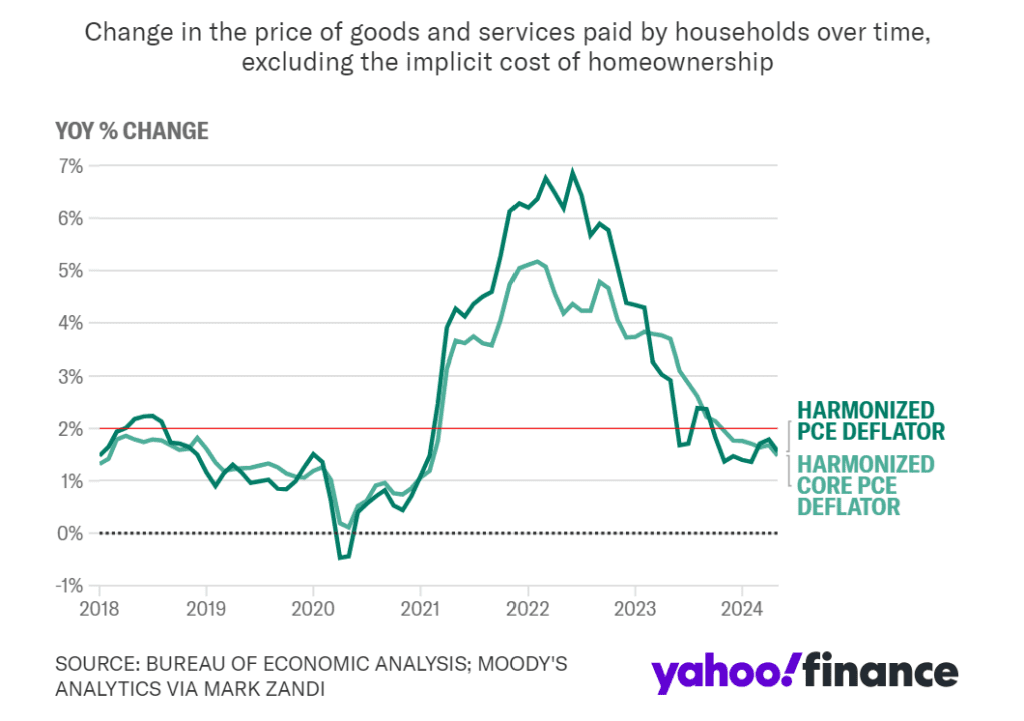
Excluding Homeownership Costs: Harmonized inflation, excluding homeownership costs, falls firmly below the Fed’s 2% target. Recognizing this measure can help justify rate cuts without undermining the Fed’s credibility.
INFLATION DATA FACES TOUGH COMPARISONS
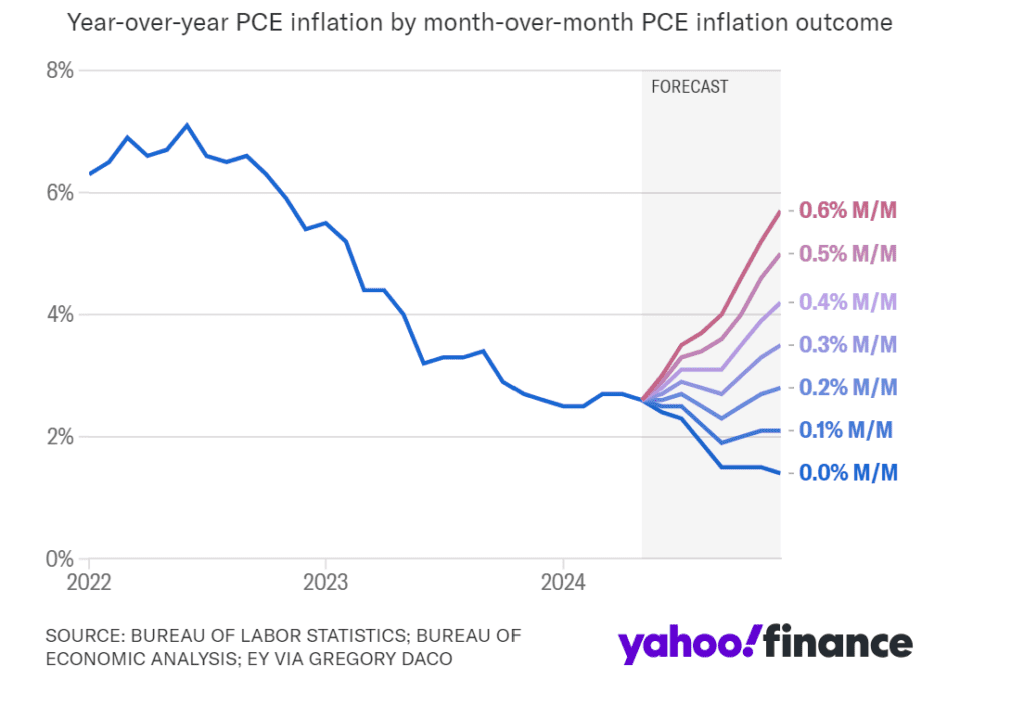
Persistent Plateau: PCE inflation is expected to hover around 2.6%-2.7% through the summer, with declines anticipated by September. Key factors include softer consumer spending growth, moderating wage growth, and increased productivity.
FISCAL SPENDING MAY HELP SLOW INFLATION
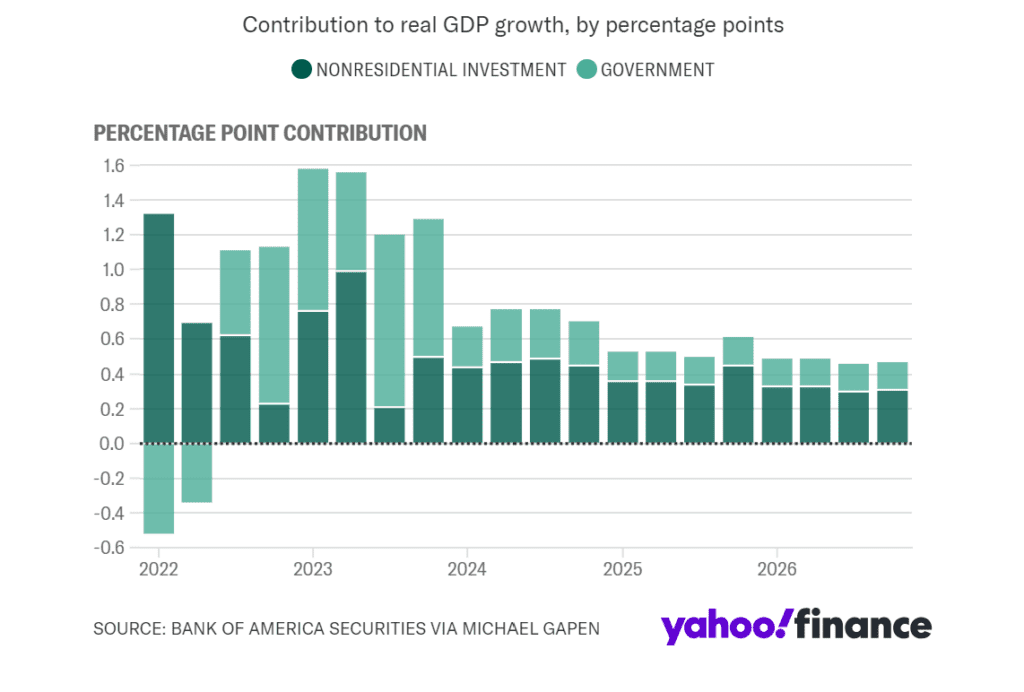
Reduced Fiscal Impact: The substantial fiscal contributions to US economic growth are expected to decrease over time. This moderation will help in decelerating inflation and stabilizing economic growth.
LABOR DATA SUPPORTS SEPTEMBER CUT
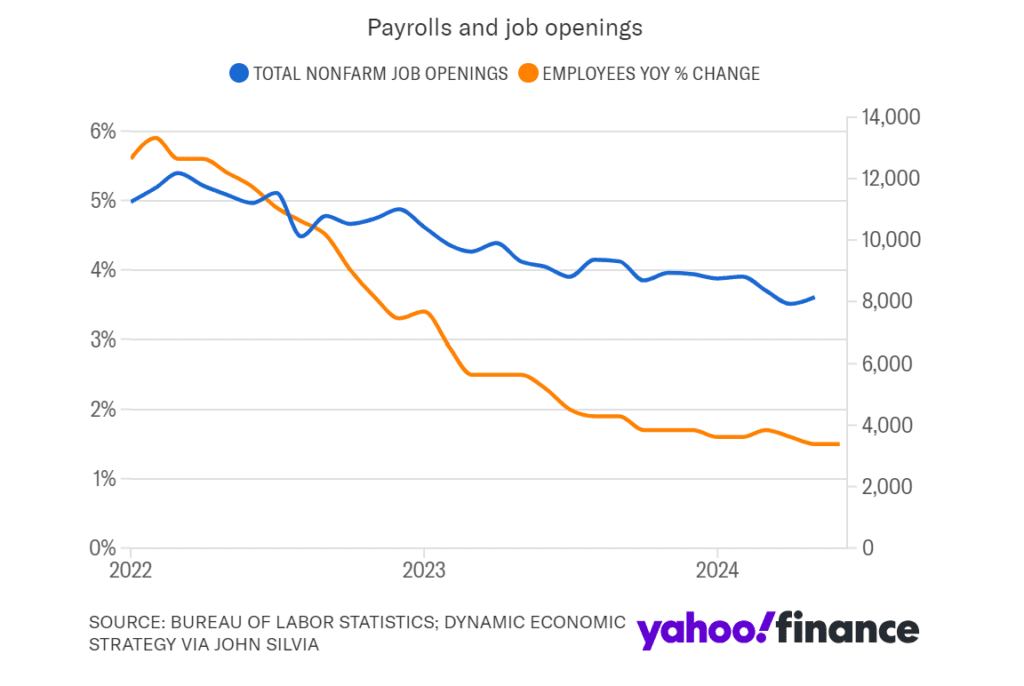
Indicators of Easing Conditions: The key labour market series cited by the Fed indicate easier conditions, supporting the case for potential easing in September. These benchmarks show significant changes in job market dynamics.
STOCKS OUTPERFORMING S&P 500 AT HISTORIC LOW
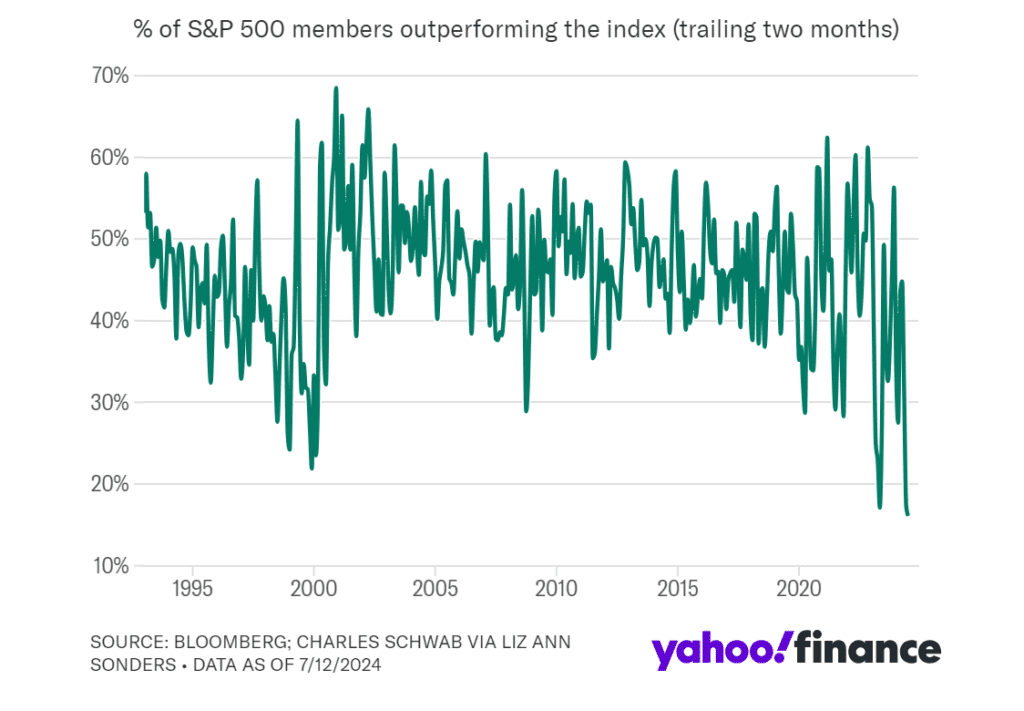
Rotation into Small Caps: The S&P 500’s internal rotations and weak underlying performance have led to increased investment in smaller-cap stocks. Investors are advised to focus on quality when diversifying into smaller stocks.
INVESTORS SKEPTICAL ABOUT SOME AI GROWTH
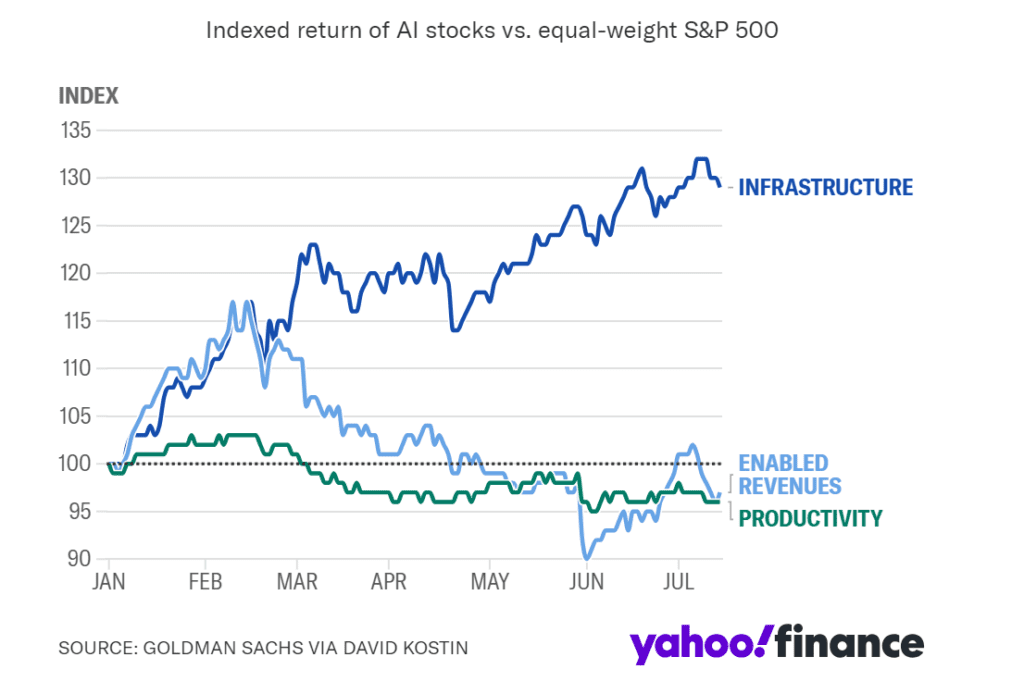
AI Beneficiaries’ Performance: Stocks tied to AI infrastructure have significantly outperformed, reflecting investor confidence in AI’s potential. However, scepticism remains about long-term impacts on earnings and productivity.
LOW VOLATILITY IS NORMAL IN BULL MARKETS
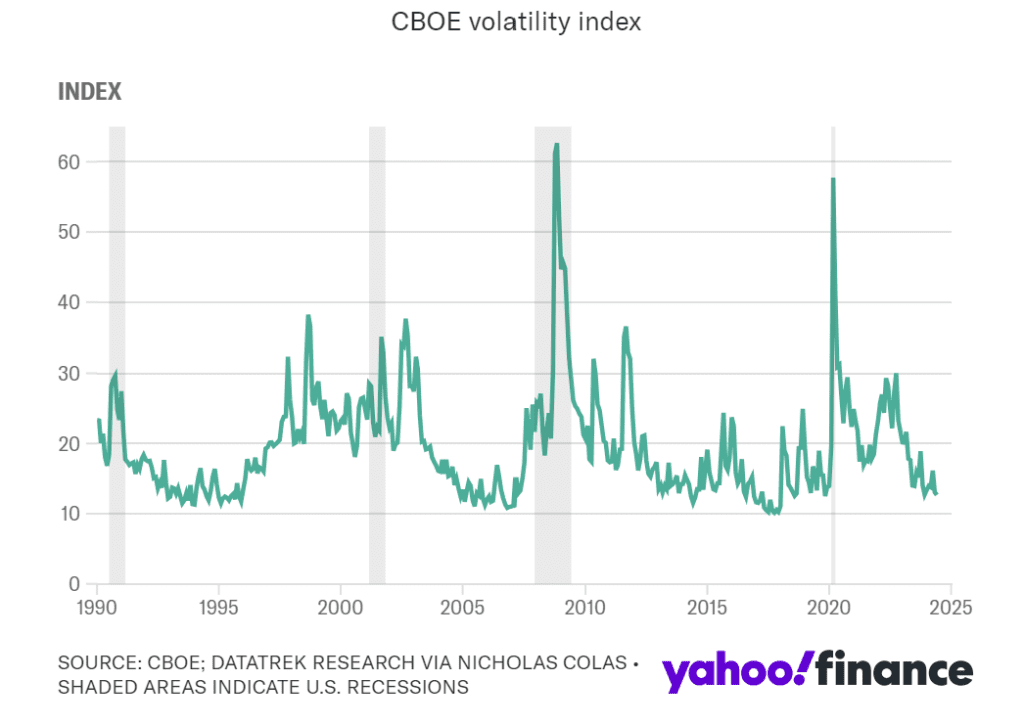
Low Volatility Trends: The low CBOE VIX Index levels are typical of bull markets, indicating healthy investor sentiment. Historical trends support the view that current low volatility is not a sign of complacency.
Click Part 2
Click Part 3


