
Many investors panic when they see double-digit market declines, mistaking normal corrections for catastrophic crashes. This confusion leads to hasty selling and missed recovery gains. Market corrections are natural market adjustments, not disasters. Understanding what they are, why they happen, and how to respond strategically transforms fear into opportunity. You’ll learn to recognize corrections, differentiate them from bear markets, and protect your portfolio through smart, evidence-based strategies.
Table of Contents
- What Is A Market Correction? Definition And Quantitative Thresholds
- Why Do Market Corrections Happen? Causes And Market Mechanisms
- Market Correction Vs. Bear Market: Key Differences Every Investor Should Know
- How Individual Investors Can Strategically Respond To Market Corrections
- Common Misconceptions About Market Corrections
- Historical Case Studies Of Market Corrections
- Secure Your Investments With Expert Financial Guidance
- Frequently Asked Questions About Market Corrections
Key Takeaways
| Point | Details |
|——-|———||
| Definition | Market corrections are declines of 10%-20% from recent highs, representing normal market adjustments. |
| Duration | Corrections typically last weeks to several months, much shorter than bear markets. |
| Causes | Overvaluation, monetary policy shifts, and investor psychology trigger these natural resets. |
| Investor Response | Avoid panic selling, maintain diversification, and focus on long-term goals during corrections. |
| Market Function | Corrections prevent larger crashes by realigning prices with fundamental values. |
What Is a Market Correction? Definition and Quantitative Thresholds
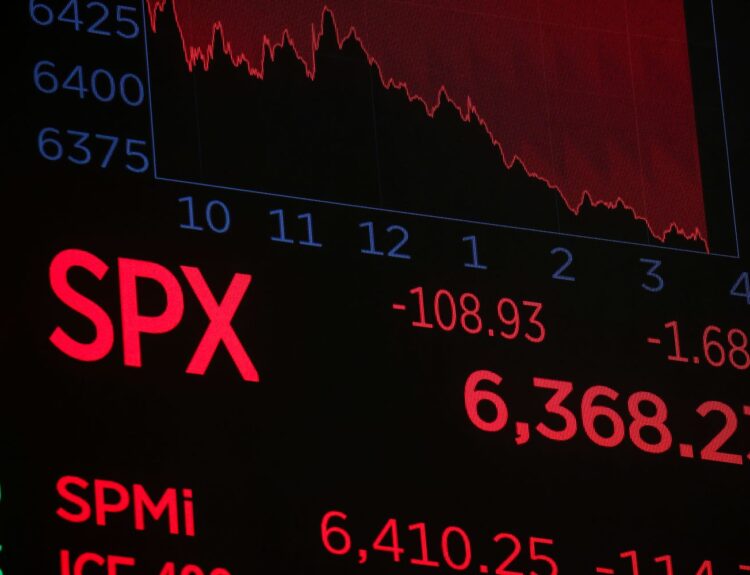
A market correction is defined as a 10%-20% drop from recent market highs. This precise threshold separates corrections from normal daily volatility and more severe bear markets. Understanding these boundaries prevents you from overreacting to routine market movements.
Corrections typically unfold over weeks to several months. The early 2020 correction during the COVID-19 pandemic saw the S&P 500 fall approximately 15% before recovering within months. This speed distinguishes corrections from prolonged downturns.
Why do these thresholds matter? Clear definitions help you avoid mislabeling everyday market noise as corrections. A 5% dip is normal volatility. A 10% decline signals a correction. A 20% drop marks bear market territory.
Key characteristics of market corrections:
- Decline between 10% and 20% from recent peak
- Duration of weeks to a few months
- Faster recovery compared to bear markets
- Driven by specific triggers rather than systemic collapse
The distinction between corrections and smaller fluctuations protects you from knee-jerk reactions. Markets routinely experience 5-7% pullbacks without triggering corrections. Recognizing genuine corrections helps you prepare appropriately without constant alarm.
Pro Tip: Track the percentage decline from the most recent market high, not from your purchase price. Corrections are measured market-wide, not portfolio-specifically.
Successful investing during market volatility requires understanding these quantitative boundaries. When you know a 12% decline is a correction, not a crash, you make calmer decisions. This knowledge reduces emotional trading and preserves long-term gains.
Why Do Market Corrections Happen? Causes and Market Mechanisms
Market corrections act as natural resets that relieve overbought conditions, preventing more severe crashes. They’re not market failures but healthy adjustments that maintain long-term stability. Think of corrections as pressure release valves in an overheating system.
Several triggers commonly spark corrections. Overvaluation occurs when stock prices rise far beyond underlying company earnings. When investors recognize this disconnect, selling accelerates. Monetary policy shifts, like interest rate hikes, make bonds more attractive relative to stocks, prompting portfolio rebalancing.
External shocks also initiate corrections. Geopolitical tensions, unexpected economic data, or regulatory changes can shift investor sentiment rapidly. These events don’t necessarily indicate fundamental economic problems but create uncertainty that drives temporary selling.
Common correction triggers:
- Stock valuations exceeding historical averages
- Central bank interest rate increases
- Disappointing corporate earnings reports
- Geopolitical events creating uncertainty
- Shifts in investor risk appetite
Corrections perform essential market functions. Systematic market corrections improve financial market efficiency by aligning prices with fundamental values. Without periodic corrections, speculative bubbles would inflate unchecked, leading to devastating crashes.
Understanding market correction causes helps you contextualize events rather than panic. When you recognize that rising interest rates historically trigger corrections, a 12% decline becomes predictable, not catastrophic. This perspective reduces fear-driven selling.
Pro Tip: Create a correction watchlist noting common triggers. When you see multiple triggers aligning, prepare mentally for potential market adjustments without changing your long-term strategy.
The market’s self-correcting mechanism protects your long-term wealth. Short-term pain from corrections prevents long-term devastation from unchecked speculation. Embracing this reality makes you a more resilient investor.
Market Correction vs. Bear Market: Key Differences Every Investor Should Know
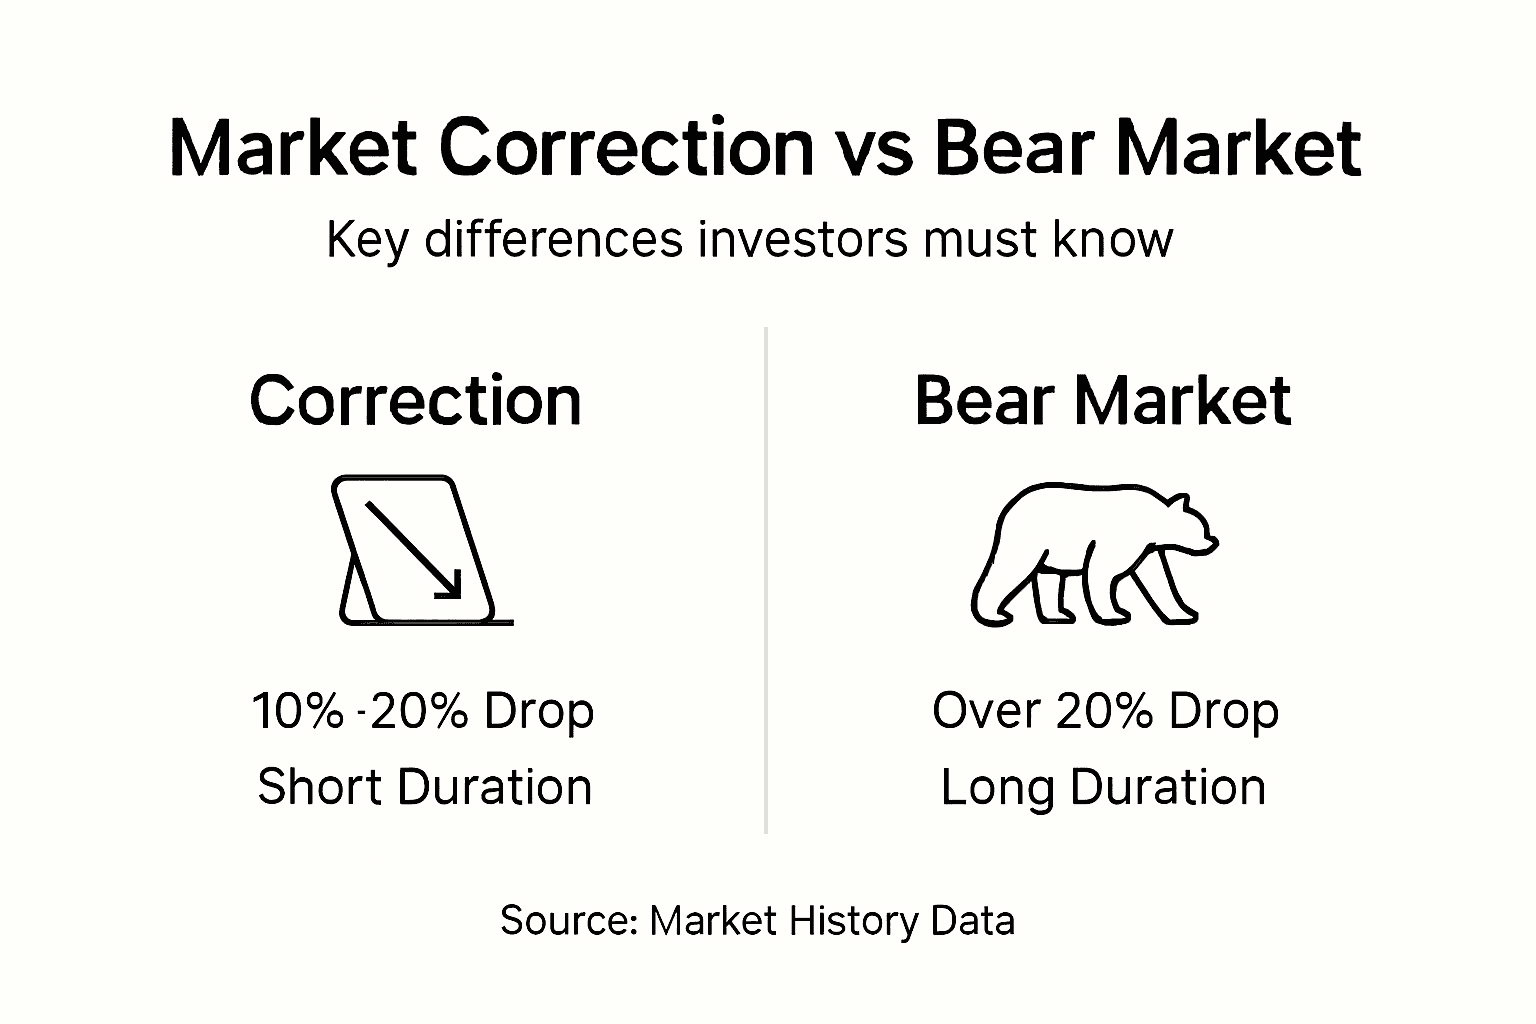
Confusing corrections with bear markets leads to inappropriate responses that damage portfolios. The differences are stark and measurable. A bear market is defined as a decline of 20% or more, marking a more severe and prolonged downturn than a correction.
| Feature | Market Correction | Bear Market |
|---|---|---|
| Decline Magnitude | 10%-20% from peak | 20% or more from peak |
| Typical Duration | Weeks to 3-4 months | Months to multiple years |
| Recovery Speed | Relatively quick | Extended, gradual |
| Market Sentiment | Cautious but stable | Pervasive pessimism |
| Economic Context | Often isolated events | Broader economic weakness |
Duration separates these events dramatically. Corrections resolve within weeks or a few months. Bear markets can persist for years, as seen in 2007-2009 when markets declined over 18 months. This timeline difference requires distinct strategies.

Investor psychology shifts between corrections and bear markets. During corrections, uncertainty dominates but doesn’t overwhelm. Bear markets create pervasive fear, panic selling, and widespread portfolio liquidation. Recognizing which environment you’re in prevents overreaction or complacency.
Strategic differences for each scenario:
- Corrections: Maintain positions, rebalance if needed, avoid panic selling
- Bear Markets: Review risk tolerance, potentially reduce equity exposure, focus on capital preservation
- Corrections: Opportunity to buy quality assets at discounts
- Bear Markets: Requires patience and potentially defensive positioning
Recovery timelines also diverge significantly. Markets typically rebound from corrections within months. Bear market recovery can take years, with gradual rebuilding of investor confidence. Understanding stock market trends helps you identify which phase you’re experiencing.
Misidentifying a correction as a bear market causes premature selling, locking in losses before recovery. Conversely, treating a bear market as a simple correction leads to overexposure during extended downturns. Accurate identification protects your wealth through appropriate responses.
How Individual Investors Can Strategically Respond to Market Corrections
Avoiding emotional decisions during corrections and maintaining a diversified, long-term portfolio leads to better outcomes. Strategic responses turn market turbulence into opportunity rather than catastrophe. Here’s your action plan.
1. Maintain Portfolio Diversification
Spread investments across asset classes, sectors, and geographies. When tech stocks correct 15%, diversified portfolios with bonds, real estate, and international holdings experience smaller overall declines. Diversification doesn’t prevent corrections but reduces their severity on your total wealth.
2. Resist Panic Selling
Emotional reactions typically cause realized losses. Selling during a 12% correction locks in that loss permanently. Markets historically recover from corrections quickly. Patience preserves capital and captures the rebound.
3. Maintain Long-Term Perspective
Corrections are temporary events in multi-decade investment timelines. A 15% decline feels significant today but becomes statistical noise over 20-30 years. Focus on your ultimate financial goals, not short-term volatility.
4. Review and Rebalance Asset Allocation
Corrections create opportunities to realign portfolios with target allocations. If stocks fall and bonds hold steady, your equity percentage drops below targets. Rebalancing means buying stocks at corrected prices, positioning you for recovery gains.
5. Evaluate Your Risk Tolerance
If a 10% correction causes sleepless nights, your portfolio may carry excessive risk for your comfort level. Use corrections as stress tests. Adjust allocations to match your actual risk tolerance, not theoretical targets.
6. Avoid Market Timing Attempts
Predicting correction bottoms or perfect re-entry points is unrealistic. Professional fund managers struggle with market timing. Individual investors fare worse. Stay invested and let time work for you.
Pro Tip: Set calendar reminders to review your portfolio quarterly, not daily. Frequent monitoring during corrections increases emotional reactions and poor decisions.
Develop an investment plan that explicitly acknowledges corrections. Include written guidelines for correction scenarios: “During 10-15% declines, I will maintain current positions and consider rebalancing.” Written plans reduce emotional decision-making when markets drop.
Explore strategies for minimizing investment risk and investing during inflation to build comprehensive resilience. Corrections test your strategy, but solid planning ensures you emerge stronger.
Common Misconceptions About Market Corrections
False beliefs about corrections undermine investor confidence and trigger costly mistakes. Dispelling these myths empowers you with accurate knowledge for better decisions.
Myth 1: Corrections Always Lead to Bear Markets
Most corrections resolve without becoming bear markets. Historical data shows corrections occur more frequently than bear markets. A 12% decline doesn’t automatically signal 20%+ losses ahead.
Myth 2: All Declines Over 10% Are Catastrophic
Corrections are normal market behavior, not emergencies. Markets have experienced dozens of corrections over decades while delivering positive long-term returns. A 10-15% decline represents routine adjustment, not disaster.
Myth 3: You Can Successfully Time Corrections
Reliably predicting correction timing is unrealistic for most investors. Even professionals with sophisticated tools struggle. Attempting to sell before corrections and buy at bottoms typically results in missed gains and increased trading costs.
Myth 4: Selling During Corrections Protects Wealth
Panic-driven selling locks in losses and causes you to miss recovery gains. Markets often rebound quickly from corrections. Selling at a 10% loss means you need an 11% gain just to break even, missing the correction recovery entirely.
Myth 5: Corrections Indicate Fundamental Economic Problems
Many corrections occur without recessions or economic crises. They often reflect sentiment shifts, valuation adjustments, or temporary uncertainties rather than systemic failures. The 2020 correction recovered despite ongoing pandemic challenges.
Myth 6: Corrections Are Harmful to Markets
Corrections actually promote market health by preventing speculative bubbles and realigning prices with fundamentals. They’re necessary adjustments that support long-term stability and efficiency.
Understanding these realities transforms your correction experience from fear to informed patience. Accurate knowledge replaces panic with strategic calm.
Historical Case Studies of Market Corrections
Real-world examples illustrate correction characteristics and investor impacts. Examining recent U.S. market corrections provides empirical evidence for strategic planning.
The 2020 COVID-19 Correction
The 2020 pandemic caused a rapid correction with recovery occurring within months. The S&P 500 dropped approximately 15% in late February through early March 2020. Within five months, markets had fully recovered and continued to new highs.
This case demonstrates correction speed and recovery potential. Investors who sold during the initial decline missed substantial rebound gains. Those who maintained positions or bought during the correction captured exceptional returns through late 2020 and beyond.
2018 Fourth Quarter Correction
Markets corrected nearly 20% in Q4 2018, triggered by Federal Reserve interest rate concerns and trade tensions. The S&P 500 recovered these losses within months in early 2019. This correction tested investor resolve but rewarded patience.
Historical Correction Data
| Period | Decline | Duration | Recovery Time | Primary Trigger |
|---|---|---|---|---|
| 2020 COVID | ~15% | 5 weeks | 5 months | Pandemic uncertainty |
| 2018 Q4 | ~19% | 3 months | 4 months | Rate hike fears |
| 2015-2016 | ~14% | 6 months | 8 months | China growth concerns |
| 2011 | ~19% | 5 months | 6 months | Debt ceiling crisis |
Investor Behavior Patterns
Data from these corrections reveals consistent patterns. Retail investors tend to sell during declines, while institutional investors often buy. This behavior explains why individual investor returns frequently lag market returns. Emotional selling during corrections creates permanent losses.
“Corrections separate disciplined investors from emotional reactors. Those who maintain strategy through volatility consistently outperform those who panic sell and attempt market timing.”
Lessons from Historical Corrections:
- Recovery timelines average 4-8 months for genuine corrections
- Markets typically reach new highs within a year post-correction
- Diversified portfolios experience smaller drawdowns during corrections
- Selling during corrections consistently underperforms staying invested
Analyzing why stocks fell and what’s behind major drops provides context for current events. Historical perspective shows corrections as temporary disruptions in long-term upward trends, not permanent wealth destroyers.
Your takeaway: corrections have happened repeatedly, and markets have always recovered. This pattern won’t guarantee future results, but it provides evidence-based confidence for maintaining your investment strategy during turbulence.
Secure Your Investments with Expert Financial Guidance
Navigating market corrections becomes significantly easier with expert financial advice tailored to your specific goals and risk tolerance. Professional advisors help you develop diversified, resilient portfolios designed to weather volatility without panic-driven decisions. They provide objective perspective when emotions run high during market declines.
Explore comprehensive resources on the benefits of a financial advisor and understand the critical role of financial advisors in wealth building. These guides reveal how professional guidance transforms market challenges into strategic opportunities. Learn about comprehensive wealth management strategies that protect and grow your assets through all market conditions. Start building a more secure investment future today by leveraging proven professional strategies designed for long-term success.
Frequently Asked Questions About Market Corrections
What percentage drop qualifies as a market correction?
A market correction is defined as a decline between 10% and 20% from recent market highs. Drops below 10% are considered normal volatility, while declines of 20% or more signal bear market territory.
How long do market corrections usually last?
Corrections typically last from several weeks to three or four months. Historical data shows most corrections resolve within this timeframe, much faster than bear markets which can persist for years.
Can investors predict when a correction will occur?
Reliably predicting correction timing is unrealistic for most investors, including professionals. While certain indicators suggest increased correction risk, precise timing remains extremely difficult and attempting it often reduces returns.
Is selling during a correction a good idea?
Selling during corrections typically locks in losses and causes you to miss recovery gains. Markets historically rebound from corrections quickly, rewarding investors who maintain positions rather than panic sell.
How do corrections affect long-term investment goals?
Corrections have minimal impact on long-term investment goals when you maintain your strategy. Over multi-decade timelines, corrections become minor statistical events that don’t derail wealth accumulation for disciplined investors.
Should I buy stocks during a market correction?
Buying quality assets during corrections can enhance long-term returns, provided you have available capital and maintain diversification. Corrections offer opportunities to purchase investments at reduced prices before recovery.