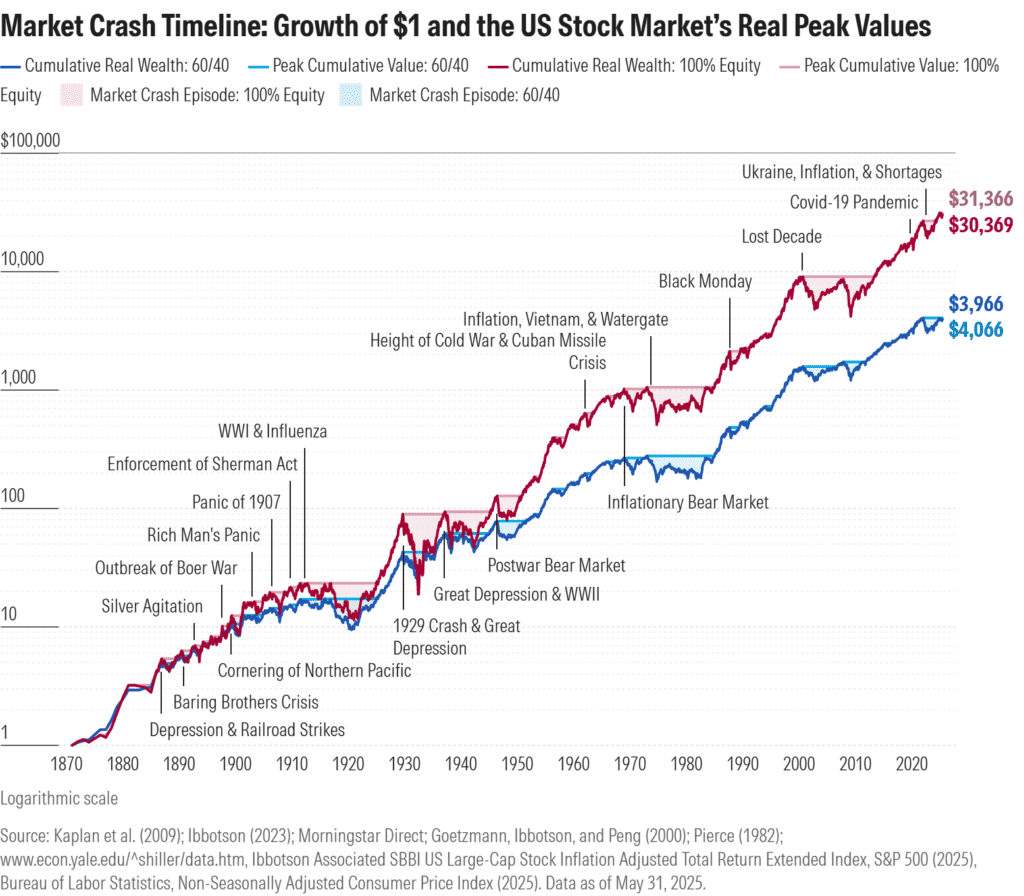
A brutal bond rout in 2022‑24 created the first bear market in a century‑and‑a‑half where a classic 60 % stocks / 40 % bonds mix felt worse—if only briefly—than an all‑equity allocation. Digging into long‑run data shows why this is so rare and how diversification usually softens the blow when crises strike.
Over the past 150 years investors have endured 19 equity bear markets and only three truly nasty bond sell‑offs. Put the two assets together and you get 11 downturns for a 60/40 portfolio—usually shallower and shorter than the stock storms alone. Below is the context, then the numbers.
How deep were the worst drops?
When big crashes hit, a diversified mix has almost always lost less—and come back faster—than equities. The table highlights the five most extreme drawdowns for stocks and the balanced mix.
| Period (shorthand) | Max drop (60/40) | Max drop (stocks) |
|---|---|---|
| Great Depression | –52.6 % | –79 % |
| 1970s stagflation | –39.4 % | –51.9 % |
| Lost Decade (2000‑09) | –24.7 % | –54 % |
| Covid 2020 | –8.5 % | –33.8 % |
| 2022 bond‑stock combo* | –25.1 % | –28.5 % |
*the current cycle—only time pain for 60/40 eclipsed stocks
Depth is only half the story; duration matters too. Paul Kaplan’s pain index rolls the two into a single severity score. On that gauge, the Great Depression crash is set to 100 % pain. Here’s how other downturns stack up:
| Crash | Pain (stocks) | Pain (60/40) |
|---|---|---|
| Great Depression | 100 % | 23 % |
| Lost Decade | 61 % | 8 % |
| Bond‑inflation shock (2022‑25) | 18 % | 20 % |
| Covid crash | 9 % | 2 % |
In aggregate, a balanced portfolio has cut drawdown pain by roughly 45 % versus going all‑in on stocks.
Two case studies highlight the pattern
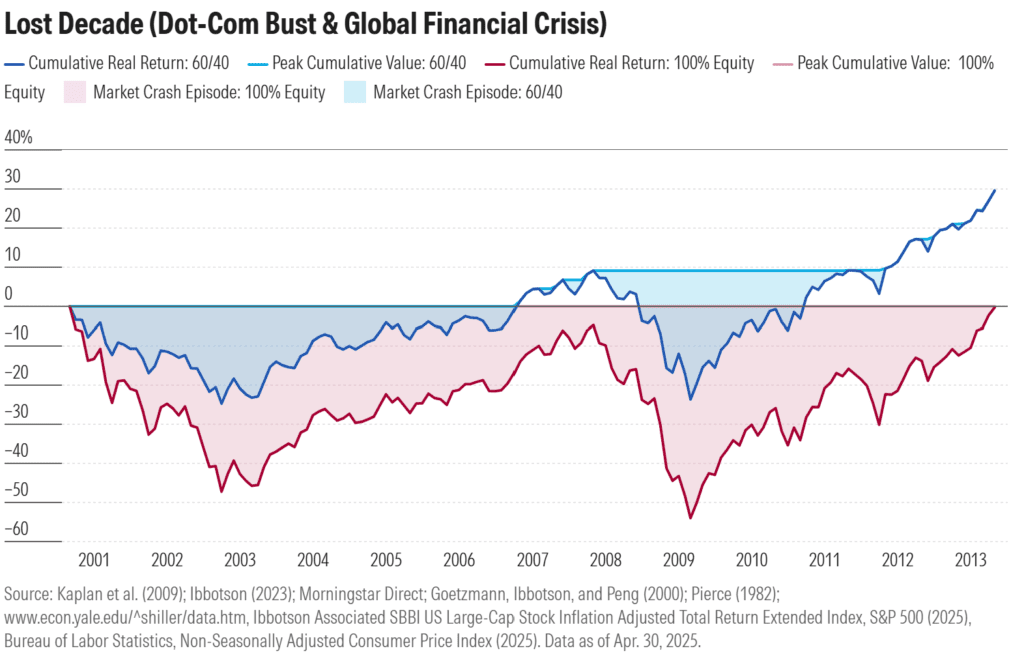
1. The Lost Decade (2000‑09)
The dot‑com bust and Great Recession carved a 54 % hole in equities; the 60/40 mix fell half as much and clawed back losses years earlier, sparing investors most of the psychological damage.
Sequence: Dot‑com bust → 9/11 → housing crash → Great Recession.
Stocks: –54 % peak‑to‑trough; underwater until 2013.
60/40: –24.7 % first leg, briefly recovered in 2007, then –23.7 % in the second leg; fully above water by early 2010.
Pain multiplier: Equity‑only investors felt eight times more pain.
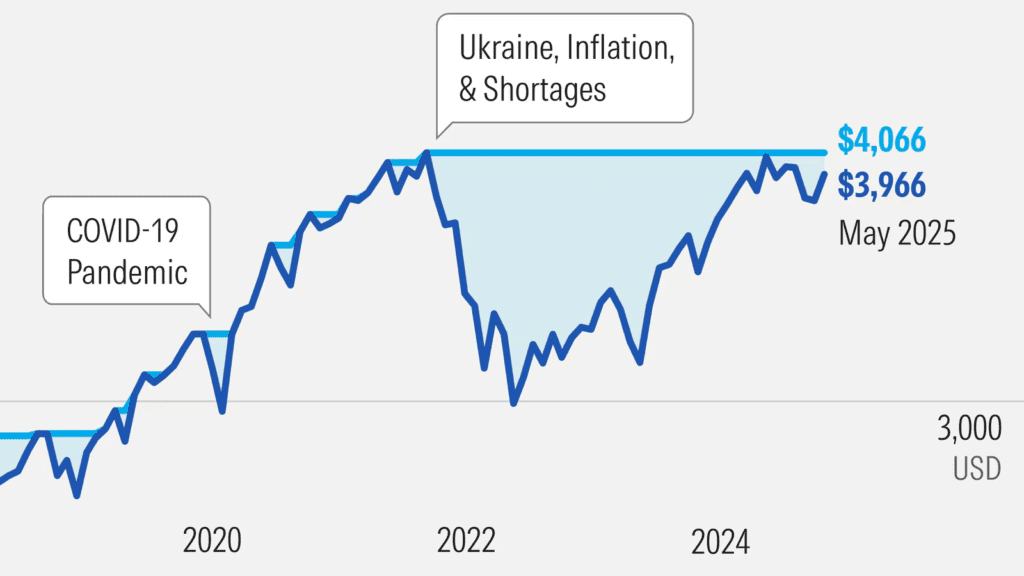
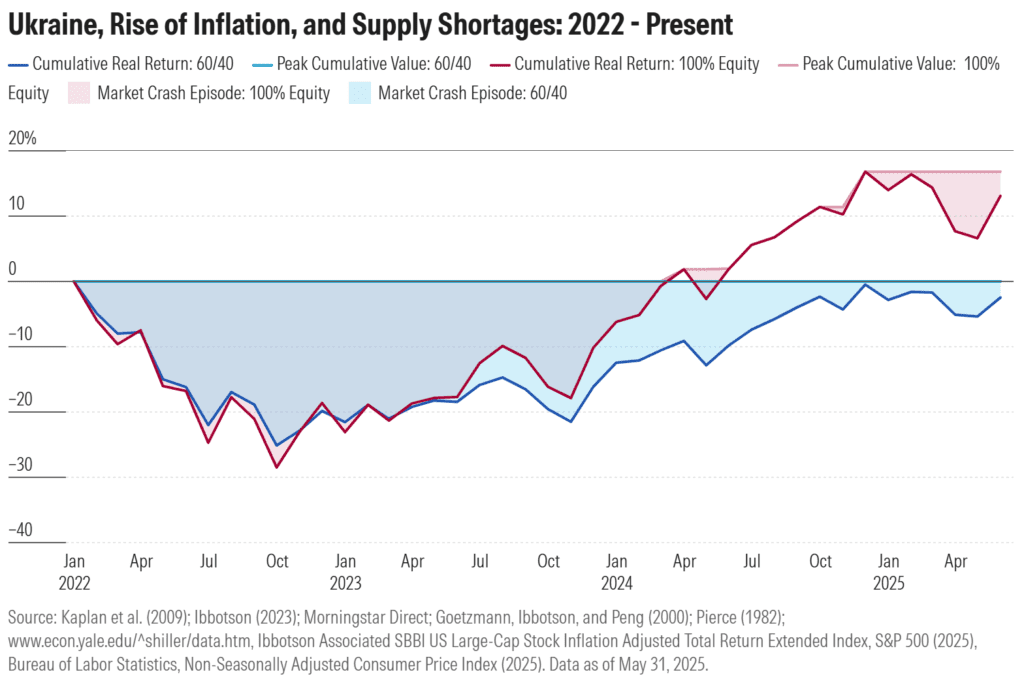
2. The current bond‑inflation shock (2022‑present)
A once‑in‑a‑lifetime fixed‑income slump kept bonds underwater even after stocks recovered in 2024. The 60/40 decline was still shallower than stocks, but sluggish bond prices have stretched out the recovery—making this the only instance where the balanced pain index tops that of equities.
Trigger: Energy shock, supply snarls, policy tightening.
Stocks: ‑28.5 % decline, back to record highs by Sep 2024.
Bonds: Worst slide since data begin in 1871, still underwater.
60/40: –25.1 % drawdown; depth smaller than stocks but recovery delayed by bonds—first episode where balanced investors feel marginally more pain.
Why it still pays to diversify
- Crashes are impossible to time, and they can come from either market.
- Shallower holes mean faster escapes, critical for retirees relying on withdrawals.
- Even today’s rare bond rout didn’t send the 60/40 deeper than the worst stock drawdowns.
The last 150years confirm that the 60/40 mix is rarely the star performer, but almost always the better shock absorber—still the best long-term defence against the unknown shape of the next crisis.
Disclosure: This article does not represent investment advice. The content and materials featured on this page are for educational purposes only.
The original news is here.
Related:
Trump To Open 401k Market To Crypto, Gold, And Private Equity
93.5 % Battery Material Tariff by US: 5 Stocks Poised to Benefit Most From It
How Nvidia Jensen Huang Persuaded Trump to Sell AI Chips to China
Stocks Inch Up as Trump Softens Tariff Talk; CPI and Bank Earnings Ahead
JPMorgan Targets KOSPI 5,000; Short Bets Hit Record
Tariff Shock, or Just a Ripple? June CPI Faces Market That No Longer Flinches
Week Ahead (July 14 – 18): Inflation Check, Big Bank Earnings, Tech Titans