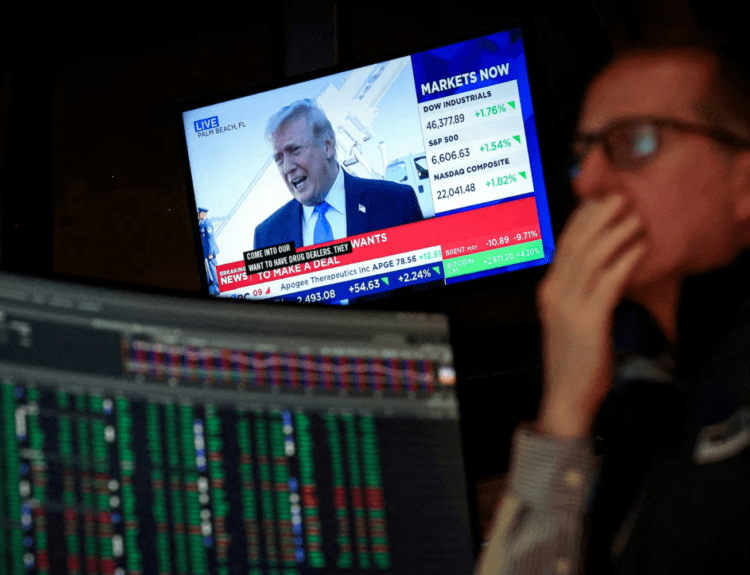
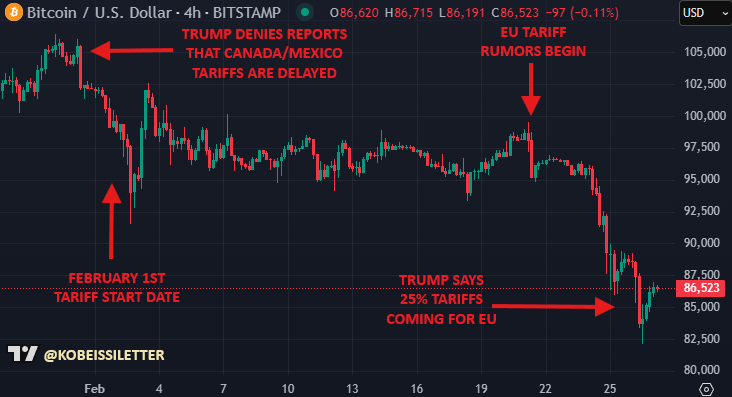
Since trade war worries began on January 20th, crypto markets have erased -$800 BILLION. For 10+ years, Bitcoin was viewed as a decentralized HEDGE against uncertainty, but something changed.
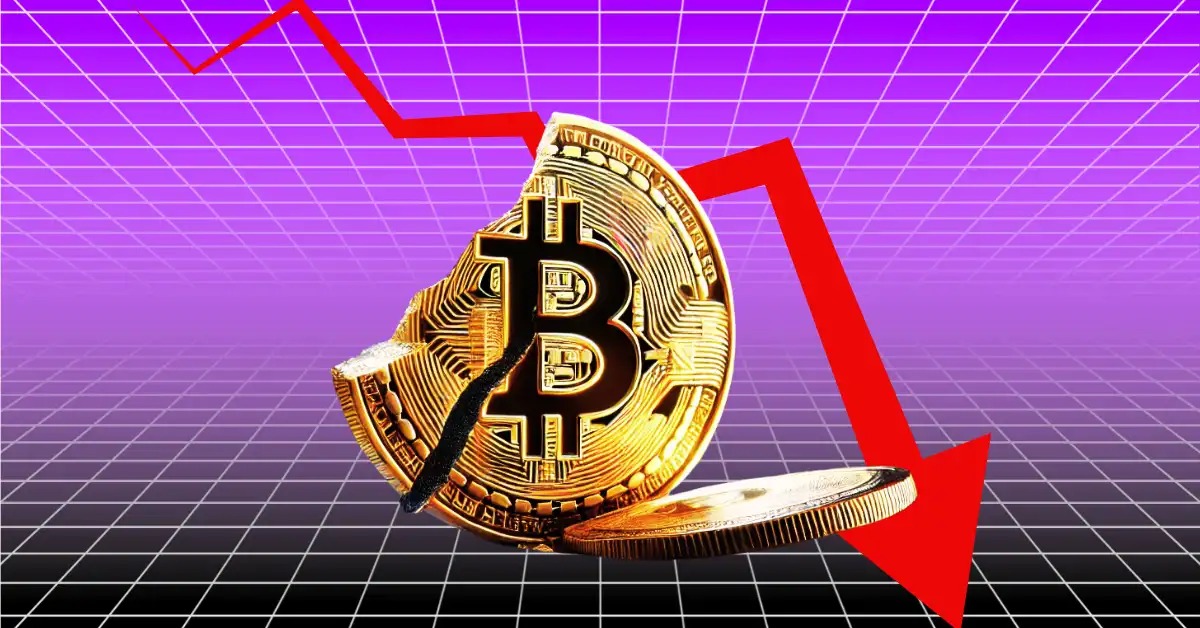
Why is crypto falling?
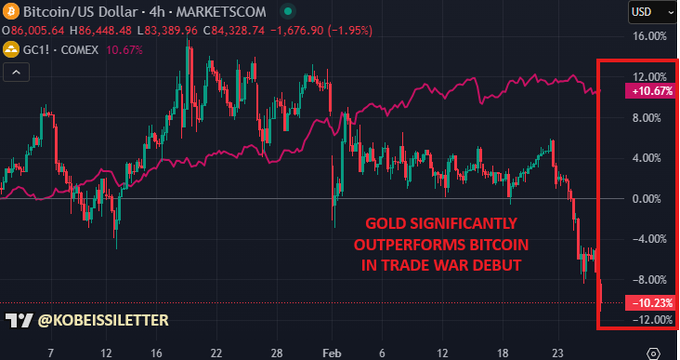
At first glance, you may think that trade wars would benefit crypto, a decentralized system. In fact, from 2015 through 2023, Bitcoin and Gold were viewed as SUBSTITUTES.
Now, Bitcoin and Gold are moving in opposite directions, as seen below. Markets have clearly SHIFTED.
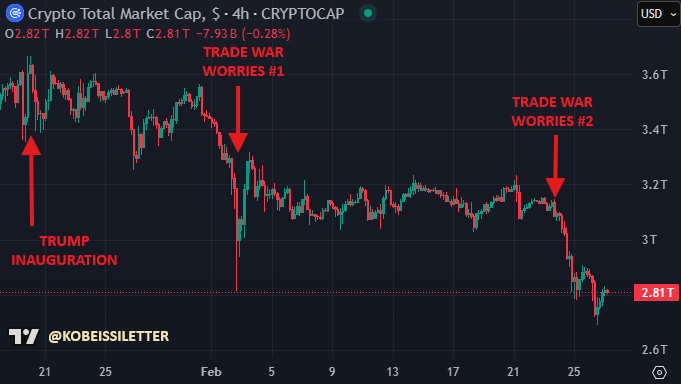
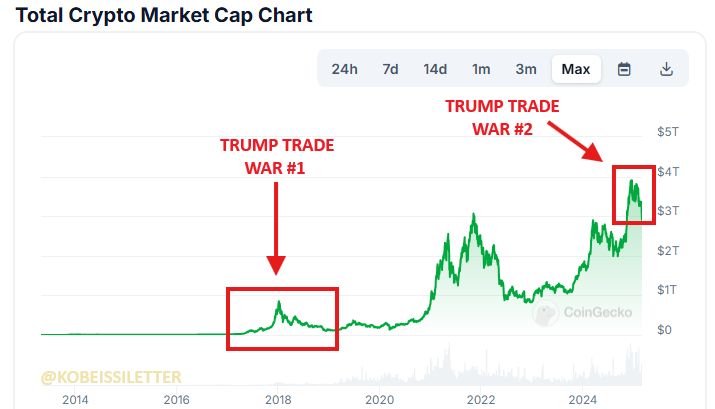
In fact, the inauguration of President Trump on January 20th marked the near-term TOP in crypto. Total crypto market cap has fallen from $3.7 trillion to $2.8 trillion in ~5 weeks.
Even more interesting is that President Trump is the most pro-crypto president in HISTORY.
So what changed?
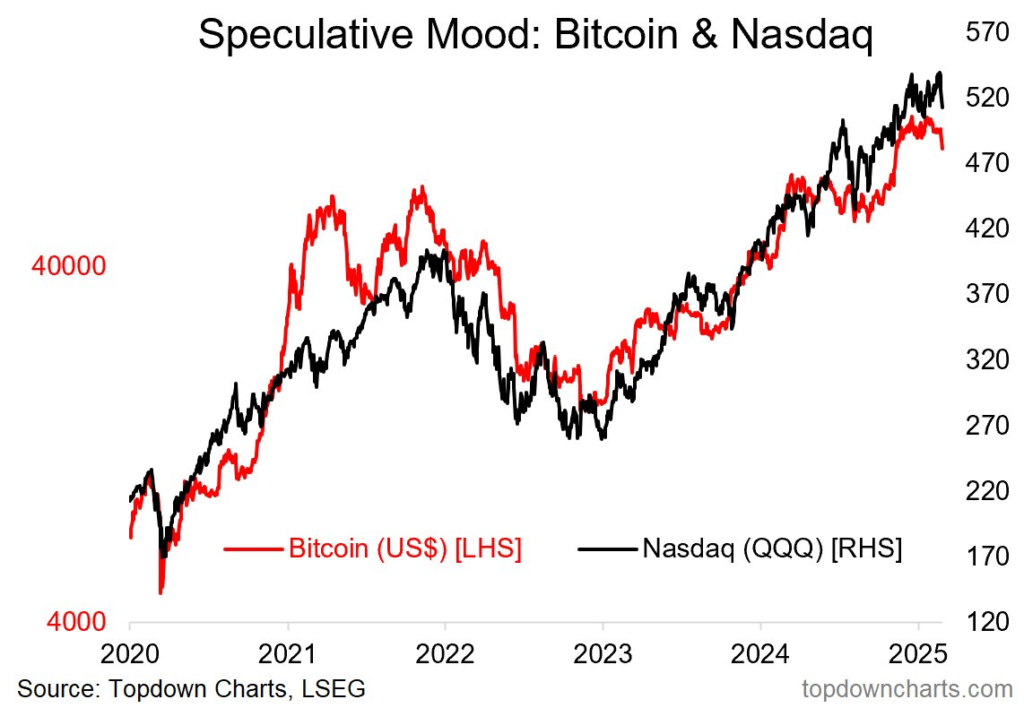
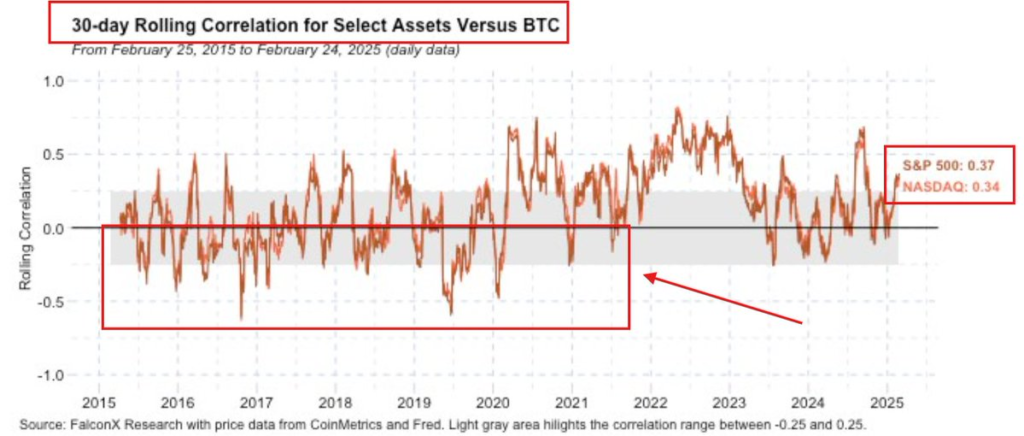
First, crypto’s correlation with risky assets as grown rapidly.
As seen below, Bitcoin has traded almost PERFECTLY in-line with the Nasdaq 100 since 2023.
In 2024, the correlation coefficient between Bitcoin and the S&P 500 hit 0.88 at its peak. This means that at peak correlation, Bitcoin moved in-line with the S&P 500 88% of the time.
Even now, the 30-day rolling correlation between the S&P 500 and Nasdaq is nearing ~0.4.
In the past, we would have seen a NEGATIVE correlation as the asset was viewed as a HEDGE. Adding to this, markets are pricing-in reduced LIQUIDITY.
As we have learned since 2020, crypto weakens when liquidity dries up.
The best example of this was the February 1st crypto “flash crash.” A sudden drop in liquidity resulted in a -$760 BILLION drop in 60 hours.
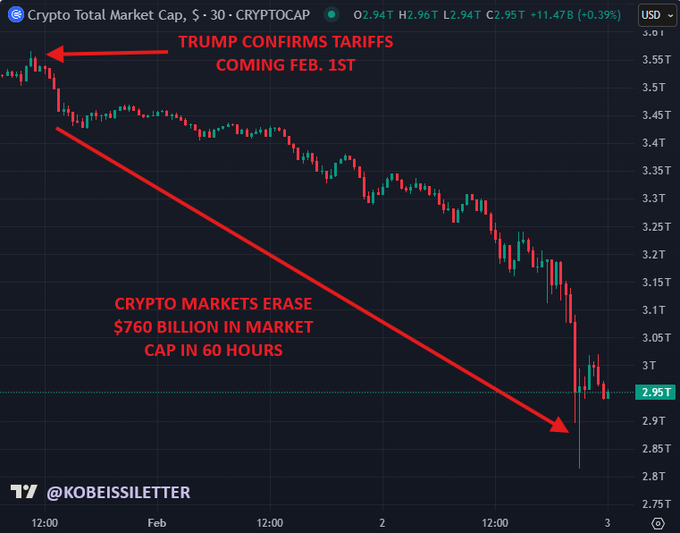
Where does this liquidity go?
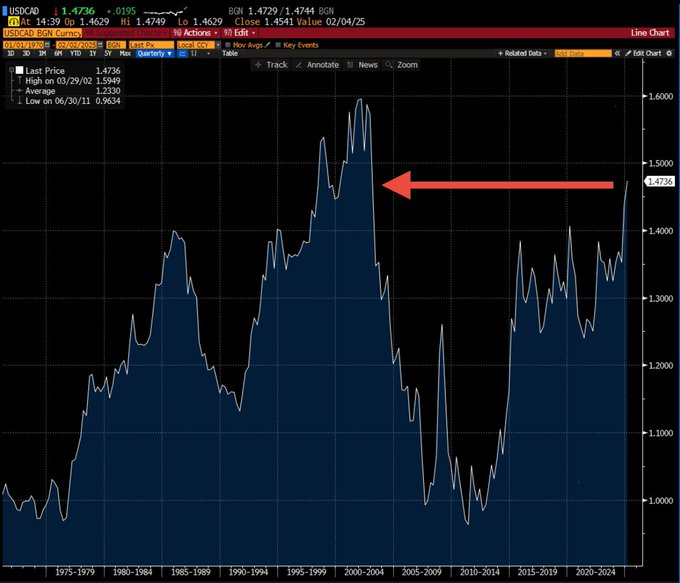
Ironically, a lot of it flows back into the US Dollar. The US Dollar becomes the “safest risky asset” during trade wars because it’s the most “stable” currency.
This explains why the USD hit its strongest level against CAD since 2003 this month.
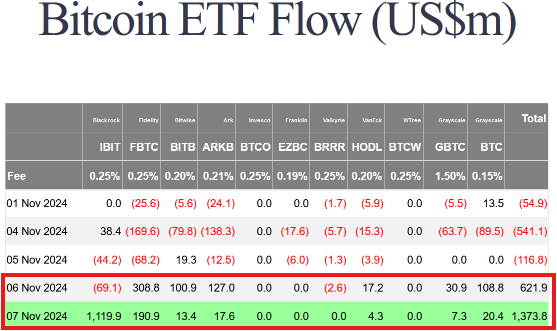
On top of this, we are seeing RECORD levels of retail capital in crypto markets.
In the 2 days after the election alone, Bitcoin ETFs saw $2 BILLION of inflows. In addition to the post-election rally, the launch of the Trump memecoin onboarded MILLIONS of retail traders.
The perceived loss of STABILITY during trade wars worries retail.
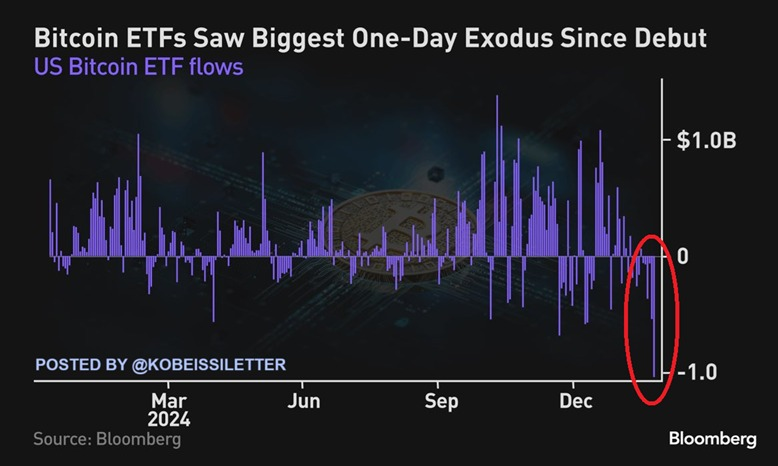
As a result, we see massive daily outflows as the “herd” moves together. When outflows in crypto and crypto ETFs surge, we see “air pockets” in price action.
This is why BTC can fall $5,000+ in minutes. In fact, Bitcoin ETFs posted a -$1.0 billion outflow on Tuesday, the biggest 1-day withdrawal on record.
Bitcoin ETFs have now seen 6-straight daily withdrawals, totaling -$2.1 BILLION. The majority of withdrawals were taken by retail investors.
Liquidity has dropped.
Additionally, we have very little precedent for crypto during trade war environments. During the last trade war, the total crypto market was worth just ~$300 million.
Now, it’s 10 TIMES larger with much more widespread adoption. This means the swings will broaden.
Also, gold appears to have taken the spotlight as the global hedge against uncertainty.
Gold ETFs bought a whopping 52 tonnes of the metal last week, the most since July 2020. Gold prices are now up +50% in 12 months and just posted their best year in over a decade.

Lastly, polarization of institutional positioning in crypto is adding to volatility. Short positioning in Ethereum surged +500% since November 2024, adding $2B+ in ETH shorts.
Could a short squeeze be next?
Disclosure: This article does not represent investment advice. The content and materials featured on this page are for educational purposes only.
Source: TKL
Related:
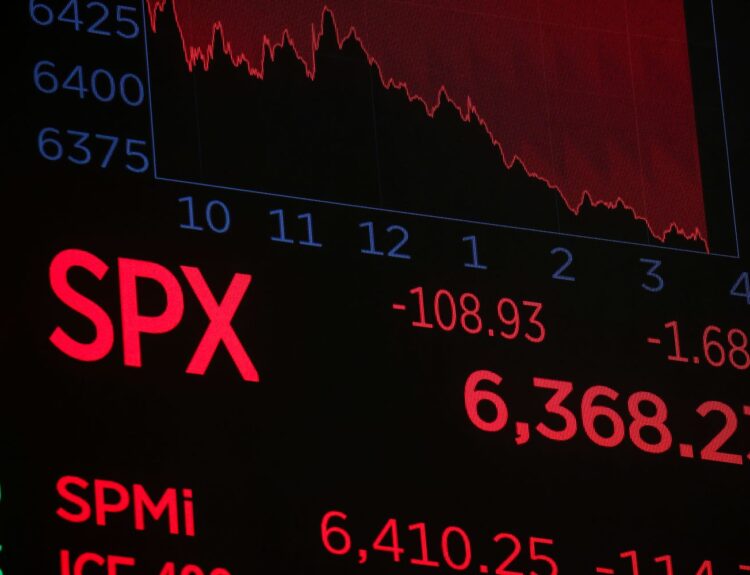
Trade war is back: After new tariffs S&P 500 erased $500+ BILLION of market cap, Bitcoin dropped
Trump vows March 4 tariffs for Mexico, Canada, extra 10% for China over fentanyl
How Trump’s 25% EU Tariffs Could Impact the Stock Market & Key Sectors
How Will Tesla Be Affected by 25% EU Tariffs?
Trump vows to slap 25% tariffs on EU and claims bloc was ‘formed to screw US’
Amazon Unveils Ocelot: A Game-Changer for Quantum Computing?
Covid and a Reminder about Long Term Investing
Understanding the Fed’s Rate Decisions: High or Low Interest Rates?
3 Value Stocks that are Backed by the World’s Largest Activist Hedge Fund
Is $MSTR “forced liquidation” possible and what happens if Bitcoin falls?
Why Nvidia’s earnings are important to the entire US stock market
Daily Market Brief: Stocks Struggle, Bitcoin Drops & Earnings Highlights