Crypto analysis is essential for understanding cryptocurrency markets and predicting price trends. After exploring the types and strategies in Part 1, this guide delves into advanced techniques and essential indicators used by traders and investors to refine their decisions.
Advanced Techniques in Crypto Analysis
Crypto analysis techniques go beyond basic evaluations, using advanced tools and metrics to offer deeper market insights.

1. Chart Patterns
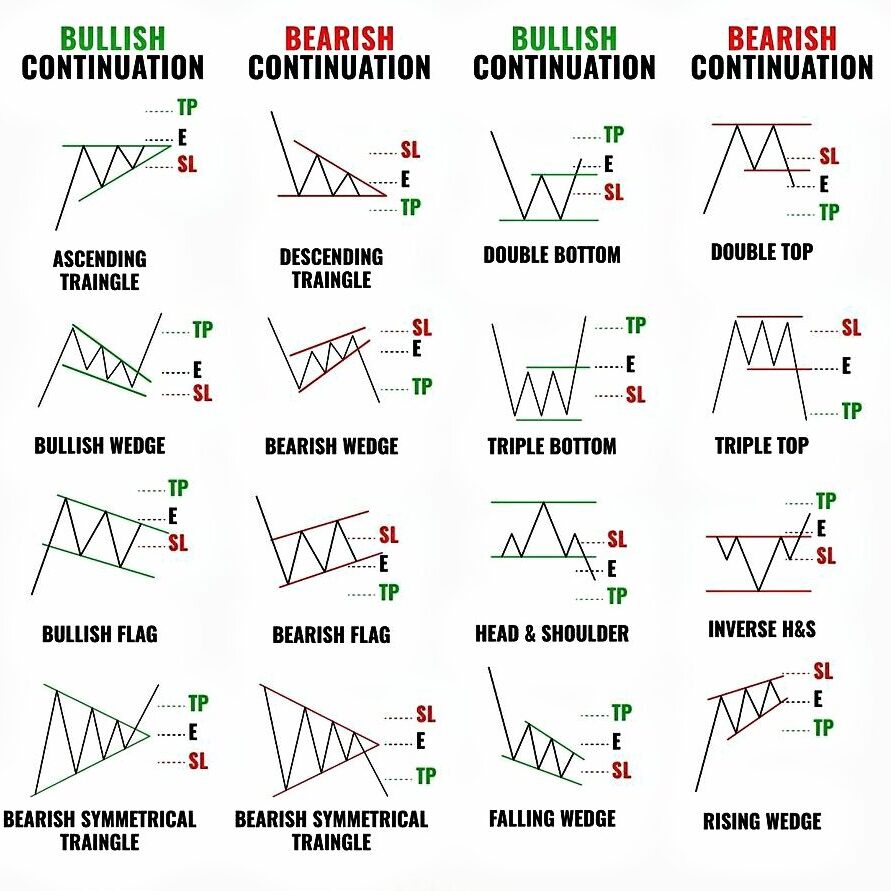
Chart patterns help traders predict market movements by analyzing price action. Example: A Head and Shoulders pattern with a clear neckline break may suggest a downward trend, prompting traders to sell.
- Common Patterns:
- Head and Shoulders: Indicates a potential bearish reversal.
- Double Tops and Bottoms: Signal reversals in uptrends or downtrends.
- Flags and Pennants: Represent continuation patterns during strong trends.
2. On-Chain Metrics
On-chain analysis involves studying blockchain data to measure network activity and user behavior. Example: A spike in Ethereum’s transaction volume during an NFT boom reflects heightened market activity.
- Metrics to Monitor:
- Hash Rate: A rising hash rate suggests network security and miner confidence.
- Active Addresses: Growing active addresses indicate increasing user adoption.
- Transaction Volume: High transaction volume often correlates with strong price action.
3. Sentiment Analysis Tools
Sentiment analysis evaluates the public perception of cryptocurrencies through social media trends, news coverage, and forums. Example: Positive mentions of Bitcoin on Twitter often lead to short-term price increases.
- Tools for Sentiment Analysis: CryptoPanic: Aggregates news to track market sentiment, LunarCrush: Monitors social media mentions and engagement.
Essential Indicators for Crypto Trading
Indicators provide data-driven insights to predict price movements and identify optimal entry and exit points.
1. Moving Averages (MA)
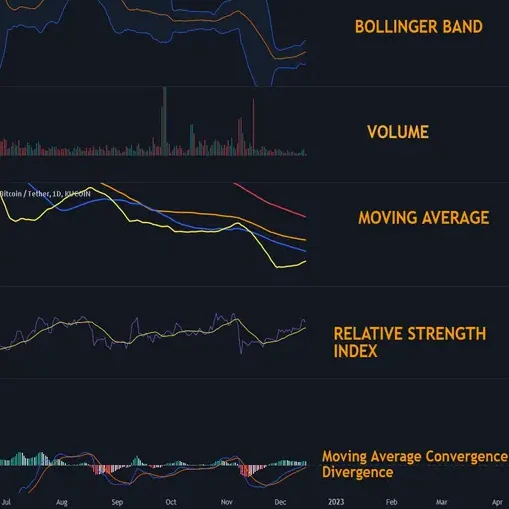
Moving averages smooth out price data over time, helping traders identify trends and potential reversals. Example: A 50-day SMA crossing above the 200-day SMA signals a bullish trend (Golden Cross).
- Types:
- Simple Moving Average (SMA): Averages closing prices over a specific period.
- Exponential Moving Average (EMA): Places more weight on recent prices for faster trend detection.
2. Relative Strength Index (RSI)
The RSI measures the speed and change of price movements, identifying overbought or oversold conditions. Example: An RSI reading of 25 on Bitcoin suggests a potential buying opportunity.

- Key Levels: Above 70: Overbought, potential price drop. Below 30: Oversold, potential price increase.
3. MACD (Moving Average Convergence Divergence)
MACD shows momentum by comparing two moving averages and their divergence. Example: A bullish crossover occurs when the MACD line rises above the signal line.
- Components:
- MACD Line: Difference between two EMAs.
- Signal Line: EMA of the MACD line.
- Histogram: Visual representation of the difference between MACD and Signal Lines.
4. Bollinger Bands
Bollinger Bands measure price volatility by plotting bands around a moving average. Example: Bitcoin trading near the upper band may indicate an overbought condition. Narrow bands indicate low volatility, often preceding sharp price movements. Wide bands suggest high volatility.
5. Fibonacci Retracement
This tool identifies potential support and resistance levels based on Fibonacci ratios (23.6%, 38.2%, 50%, 61.8%). Example: Ethereum retracing to the 61.8% level after a price surge may signal a strong support zone for buying.
6. Volume Indicators
Volume reflects the number of transactions for a specific cryptocurrency within a given period. Example: A spike in Bitcoin’s trading volume during a breakout confirms the strength of the trend. High volume during price increases suggests strong market interest. Low volume during price moves could indicate weak momentum.
Related articles:
- What is Crypto Analysis: Types and Strategies – Part 1
- What are some benefits of using cryptocurrency as a method of payment?
- What is cryptocurrency mining? A Beginner’s Guide to Getting Started
- What is Cryptocurrency Solana (SOL) and How Does It Work?
- How to Buy Solana Meme Coins and Create Your Own on Solana
- How to Sell Bitcoin: A Step-by-Step Guide for Beginners
- How to Pay with Cryptocurrency: A Guide to Digital Payments
- What Are Meme Coins & How Do They Work?
- How to Buy Meme Coins: A Beginner’s Guide
- How to Trade in Crypto: Risks and Rewards
- Which are Best FREE Crypto Exchanges & Apps in 2024
Sources:
- https://www.bitstamp.net/learn/crypto-trading/advanced-technical-analysis-techniques-for-crypto-3/
- https://www.tokenmetrics.com/blog/cryptocurrency-analysis-how-to-analyze-cryptocurrencies
- https://cointelegraph.com/learn/articles/cryptocurrency-investment-the-ultimate-indicators-for-crypto-trading
- https://onetrading.com/blogs/crypto-fundamentals-crypto-trading-strategies-for-beginners


