This week felt different. Because one of the country’s biggest tech companies sees its share price skyrocket by as much as 43%. Oracle is not a penny stock, a startup or a meme stock. A surge of this magnitude should make everyone reassess where markets are and whether this boom is moving into unsustainable territory.
Below are five charts that suggest what former Federal Reserve Chair Alan Greenspan termed “irrational exuberance” may be engulfing AI and tech.
1. Oracle’s soaring valuation
Oracle, the cloud computing giant, saw its stock trade at nearly 50x estimated 12-month forward earnings on Wednesday, the highest since the dotcom crash when its forward PE topped 120. Its share price rose as much as 43% on the day, causing it to virtually double since June.
Oracle did say it expects cloud revenue to exceed half a trillion dollars and announced four new multi-billion contracts, so some optimism is warranted. But should the company truly be worth twice as much as it was only three months ago?

2. The Nvidia juggernaut
Nvidia’s share price has doubled since April, rising an eye-popping 300% in the last two years. The AI chip superpower is now the world’s most valuable company with a market cap of $4.3 trillion, larger than every country’s listed stock exchange apart from the U.S., China, Japan and India, according to Deutsche Bank.
Sure, Nvidia continues to churn out cash, but just two customers made up 39% of its revenue in the last quarter. Is that sustainable?

3. Record-high concentration
The combined weighting of the top five companies in the S&P 500 is nearing 30%, higher than the ‘Nifty Fifty’ in the late 1960s/early 1970s and much higher than tech companies in 2000 before the dotcom bust.
This doesn’t automatically mean we’re in a bubble, but the market is in unchartered territory and heavily dependent on a handful of companies – all of them in one industry. History suggests this level of concentration rarely ends well.

4. Lofty valuations
The S&P 500 tech sector is nearing its most expensive levels since 2002 when the dust from the dotcom bust was still settling. Of course, this can be sustained as long as the cash keeps rolling in.
But the amount of AI-related capex needed to develop the industry – an estimated $6.7 trillion worldwide by 2030, according to McKinsey – means the amount of cash that will need to keep coming in is enormous. When the bar is that high, even sound companies might struggle to meet it.

5. Stretched positioning
Bank of America’s August fund manager survey showed that the most crowded trade in world markets currently is once again “long Magnificent 7”, according to 45% of those polled. A majority, 52%, say they see no AI bubble, suggesting this packed trade could get even more crowded before it unwinds.
Investors have little incentive to go against this trade as long as it remains a winning one. But when a crowded trade reverses it can be sudden, and not everyone gets out the exit door in time. A lot of investors could lose a lot of money.

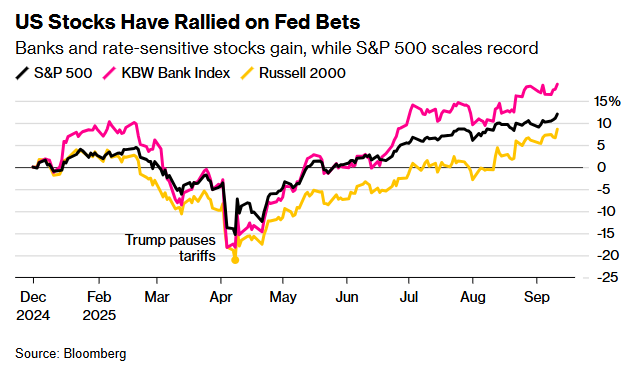
On the other hand, Bank of America’s Michael Hartnett says markets trust the Fed’s timing on rate cuts. Bank stocks and small caps are rallying, credit spreads are tight, and the KBW Bank Index is up for a fifth month, signaling investors believe cuts align with growth. An 8% bank index drop or wider spreads would suggest the Fed is late.
Disclosure: This article does not represent investment advice. The content and materials featured on this page are for educational purposes only.
Gold Surpasses Inflation-Adjusted Record High Set in 1980
CPI report shows prices climbing faster than July, What it means for Fed
France’s Government Collapses — What Moved in Markets and What’s Next
The Big Question: Are Crypto ETFs About to Explode?
ETF Boom or Bubble? US Now Has More ETFs Than Stocks as Retail Piles In
Bitcoin ETFs Surge on Trump Election Prospects, Market Braces for Volatility