
TL;DR:
- Bond yield represents the actual market return on a bond, fluctuating with its price movements. It differs from the fixed coupon rate and includes measures like current yield and yield to maturity, which offer different insights into total return and risk. The inverse relationship between bond prices and yields influences investment decisions and reflects market expectations about interest rates, inflation, and economic growth.
Bond yield is defined as the annual return an investor earns on a bond, expressed as a percentage of its current market price. This figure is not fixed. It moves every time the bond’s price changes in the market, which makes it fundamentally different from the coupon rate printed on the bond certificate. According to Investopedia, two bonds with the same coupon rate but different prices carry different yields and deliver different real returns. Understanding what is a bond yield, how it is calculated, and what drives it is the foundation of any serious fixed-income investing strategy in 2026.

What is a bond yield and how is it calculated?
Bond yield is the percentage return you actually receive based on what you paid for the bond today, not what the bond originally promised. The coupon rate is fixed at issuance. The yield adjusts constantly as the market price moves. This distinction matters enormously when you are comparing two bonds side by side.
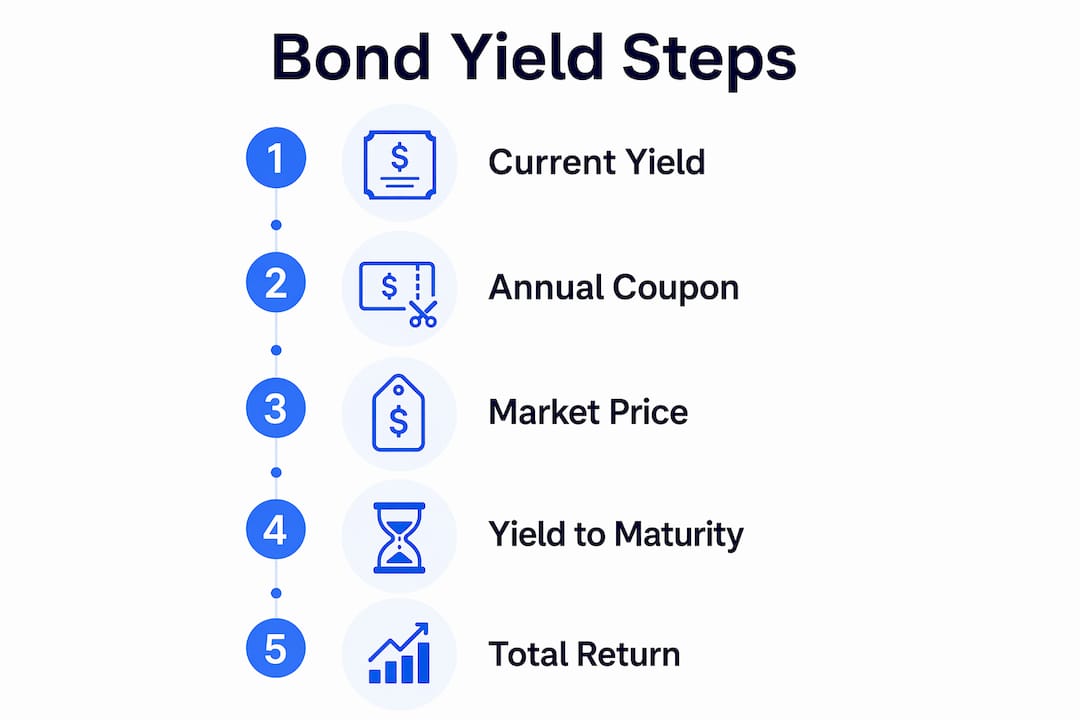
There are two primary yield measures every investor should know.
Current yield
Current yield is the simplest calculation. The formula is: Annual Coupon Payment divided by Current Market Price. If a bond pays $50 per year and trades at $950, the current yield is 5.26%. If the same bond trades at $1,050, the current yield drops to 4.76%. This formula gives you a quick income snapshot, but it ignores what happens when the bond matures.
Yield to maturity (YTM)
Yield to maturity is the comprehensive measure professionals use. YTM accounts for all future coupon payments plus any capital gain or loss you will realize when the bond returns its face value at maturity. A bond bought at $950 with a $1,000 face value will deliver a capital gain at maturity. That gain is baked into the YTM calculation, making it a more complete picture of total return.
The math behind YTM is not simple. YTM calculation requires solving an internal rate of return that equates all future cash flows to the current price. No clean algebraic formula exists for standard coupon bonds. You need numerical methods to get there.
Pro Tip: Use a financial calculator, Microsoft Excel’s IRR or RATE function, or a free online YTM calculator to solve this instantly. Doing it by hand is impractical and unnecessary.
YTM is the standard for institutional investors because it allows fair comparison across bonds with different prices, maturities, and coupon rates. If you are evaluating two bonds and only looking at coupon rates, you are missing the real story.
What is the relationship between bond prices and yields?
The price-yield relationship is inverse. When a bond’s price rises, its yield falls. When the price drops, the yield rises. Coupon payments stay fixed while market prices fluctuate, so the math forces this inverse movement every time.
Here is a concrete example. A $1,000 bond with a 5% coupon pays $50 per year. If the bond trades at $950, the yield rises to about 5.26%. If it trades at $1,050, the yield falls to about 4.76%. The coupon never changed. Only the price moved.
This relationship has direct consequences for investors:
- Buying at a discount (below face value) means your yield exceeds the coupon rate. You earn more than the stated interest because you paid less.
- Buying at a premium (above face value) means your yield falls below the coupon rate. You paid extra, so your effective return is lower.
- Buying at par (exactly face value) means your yield equals the coupon rate exactly.
The pull to par effect
One concept most beginners miss is the pull to par. As a bond approaches its maturity date, its price converges toward face value regardless of where it traded earlier. A discount bond bought at $950 will gradually climb toward $1,000 as maturity nears. That price appreciation adds to your total return beyond the coupon income. A premium bond bought at $1,050 will decline toward $1,000, eroding some of your return over time. YTM captures this effect. Current yield does not.
Understanding pull to par is especially useful when you hold bonds to maturity rather than trading them. The capital movement is predictable and built into the math from day one.
How does the yield curve affect what you earn?
The yield curve plots bond yields against their maturities, from short-term bills to 30-year bonds. It typically slopes upward, meaning longer maturities offer higher yields. This makes intuitive sense. Lending money for 30 years carries more uncertainty than lending for 1 year, so investors demand more compensation.
That extra compensation has a name: the term premium. The term premium compensates investors for inflation risk, interest rate risk, and economic uncertainty over longer durations. A 30-year U.S. Treasury bond yields more than a 2-year Treasury note not because the government is less creditworthy, but because you are exposed to more years of potential inflation and rate changes.
Here is a quick comparison of how yield characteristics shift across maturities:
| Bond type | Typical maturity | Yield level | Key risk |
|---|---|---|---|
| Short-term Treasury bill | 1 month–1 year | Lower | Minimal interest rate risk |
| Medium-term Treasury note | 2–10 years | Moderate | Moderate rate sensitivity |
| Long-term Treasury bond | 20–30 years | Higher | High inflation and rate risk |
| Corporate bond | Varies | Higher than Treasuries | Credit risk plus rate risk |
Ignoring the term premium is a real mistake. Long-term bonds carry greater interest rate risk, and investors who chase the higher yield without accounting for that risk often get hurt when rates rise. A 1% rise in interest rates can cut the price of a 30-year bond by 15% or more, far more than the same rate move does to a 2-year note.
Pro Tip: Check a bond’s duration before buying. Duration measures price sensitivity to rate changes. A bond with a duration of 10 years loses roughly 10% in price for every 1% rise in rates. This single number tells you more about risk than the yield alone.
How do bond yields affect your investment decisions?
Bond yields are the lens through which every fixed-income decision should be made. The coupon rate tells you what the issuer promised at issuance. The yield tells you what the market is actually offering today. These two numbers are often very different, and confusing them is one of the most common and costly mistakes novice investors make.
Consider this scenario. You see a corporate bond with a 6% coupon rate and assume you will earn 6% on your investment. But if that bond is trading at $1,100 because it was issued when rates were higher, your actual yield is closer to 5.3%. You are paying a premium for a bond that no longer delivers its stated return.
Here are the practical implications of yield awareness for your portfolio:
- Comparing bonds fairly requires looking at YTM, not coupon rates. Two bonds with identical coupons but different prices are not equivalent investments.
- Timing purchases around yield levels matters. Buying when yields are high locks in better returns for the life of the bond.
- Managing duration risk means understanding that rising rates hurt long-term bondholders more than short-term ones.
- Spotting opportunities in discounted bonds requires tracking yield changes, not just price movements.
Successful bond investors track yield shifts to identify when bonds are trading at discounts or premiums relative to their fair value. The gap between coupon rate and yield is where opportunities and traps both live. Recognizing which one you are looking at separates informed investors from guessers.
Pro Tip: Before buying any bond, calculate both the current yield and the YTM. If the YTM is significantly lower than the current yield, the bond is trading at a premium and the pull to par will work against you. Check Finblog’s bond yields guide for a step-by-step walkthrough of this comparison.
Key takeaways
Bond yield is the single most important number for evaluating a fixed-income investment, because it reflects actual market return rather than the original coupon promise.
| Point | Details |
|---|---|
| Yield vs. coupon rate | Yield reflects today’s market price; the coupon rate is fixed at issuance and rarely tells the full story. |
| Current yield formula | Divide the annual coupon payment by the current market price for a quick income snapshot. |
| YTM is the complete measure | Yield to maturity includes capital gains or losses and is the standard for comparing bonds fairly. |
| Inverse price-yield rule | When bond prices rise, yields fall. When prices drop, yields rise. This is always true. |
| Term premium and duration | Longer bonds yield more but carry greater rate and inflation risk. Check duration before buying. |
Why I think most investors underestimate the yield gap
I have spent years watching investors walk into bond positions armed with nothing but the coupon rate. They see 6% printed on a bond and assume that is what they will earn. The actual yield, once you account for the current price, is often meaningfully different. That gap is not a technicality. It is real money.
The most underappreciated concept in bond investing is the pull to par. When you buy a premium bond, the market price will drift down toward face value over time. That capital erosion is silent. It does not show up as a loss on your statement the way a stock drop does. But it absolutely reduces your total return. Investors who ignore it consistently overestimate what their bonds will deliver.
The yield curve is the other tool most individual investors never use. Plotting where yields sit across maturities gives you a map of where the market sees risk and opportunity. An inverted yield curve, where short-term rates exceed long-term ones, has historically preceded recessions. That is not a coincidence. The bond market is pricing in expectations about growth and inflation that equity investors often miss entirely.
My honest advice: stop looking at coupon rates first. Look at YTM. Then check duration. Then look at where the bond sits on the yield curve. Those three steps will tell you more about a bond than any marketing sheet ever will. The bond market dynamics in 2026 make this discipline more important than ever.
— Povilas
Explore bond yields further on Finblog
Finblog covers fixed-income investing with the depth individual investors actually need. If you want to go beyond the basics, the bond yields explained guide walks through real-world examples of current yield versus YTM in today’s market. For investors who are newer to the space, the article on common beginner mistakes covers the exact errors that quietly cut returns, including the coupon-versus-yield confusion covered in this article. Understanding how debt securities work in corporate finance also adds useful context for anyone evaluating corporate bonds alongside government issues. Visit Finblog for tools, calculators, and analysis built for serious investors.
FAQ
What is a bond yield in simple terms?
A bond yield is the annual return you earn on a bond based on the price you paid for it, expressed as a percentage. It changes whenever the bond’s market price changes, unlike the fixed coupon rate.
How is bond yield different from the coupon rate?
The coupon rate is fixed at issuance and based on the bond’s face value. The yield reflects the actual return based on the current market price, which can be higher or lower than the coupon rate.
What does yield to maturity mean?
Yield to maturity is the total return you earn if you hold a bond until it matures, accounting for all coupon payments plus any capital gain or loss. It is the most complete measure of bond return and the standard used by professional investors.
Why do bond prices and yields move in opposite directions?
Coupon payments are fixed, so when a bond’s price rises, the same fixed payment represents a smaller percentage of the higher price, lowering the yield. When the price falls, the fixed payment becomes a larger percentage, raising the yield.
What is the yield curve and why does it matter?
The yield curve shows bond yields across different maturities, typically sloping upward because longer-term bonds carry more risk. An unusual shape, such as an inverted curve, signals that markets expect economic conditions to change significantly.