Learnings and conclusions from this week’s charts (17/23 Feb): This week: back in the range, bad news, bad noise, souring sentiment, soaring leverage, divergences, imbalances, better investments, margin debt risk flag…
- The range trade continues (+breadth shows regime shift).
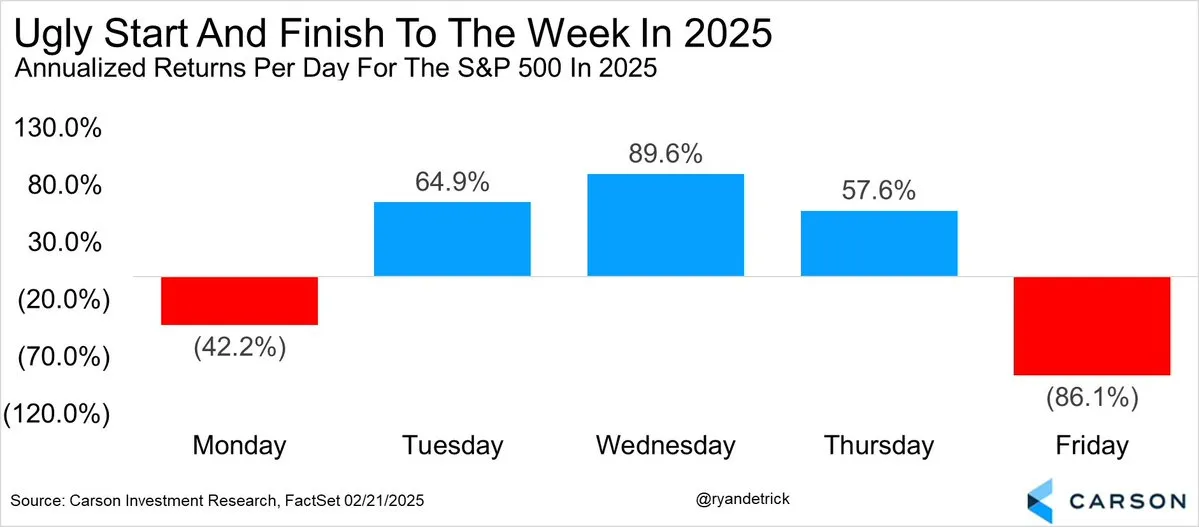
- Markets have been underperforming around the weekend.
- Bad news/noise is damaging investor sentiment.
- 2020 marked a multi-pronged shift in market behavior.
- Growth stocks are more concentrated, Value more diversified.
Overall, the range trade continues — upside pushes are being limited as sentiment shifts to a more lukewarm-bearish tone under the onslaught of ongoing bad news/noise. And that’s set against a backdrop of a very concentrated and overvalued stock market.
1. Back in the Range: To misquote that famous line, “just when I thought I was out (of the range trade), they pull me back in”. Just when everyone thought it was back to new all-time highs and onwards and upwards, Friday slammed us back into the range trade. And looking at the 200-day moving average breadth indicator in the chart below you can see that late-last year there was a regime shift from relatively strong unbothered uptrend to now much weaker, wishy-washy, and ranging. Not a sign of strength.

Source: MarketCharts
2. Bad News: You might call this one a visual representation of the Trump trade. The frenzied pace of action by the new admin — especially over the weekends, has meant a lot of de-risking into the end of the week (no one wants to hold when any number of pronouncements can happen, not to mention tense geopolitics). You also often see reactions to the latest weekend news at the start of the week, and only back to just-keep-buying mid-week. The upside? maybe this calms down later if you take the view Trump and team are front-loading their work program…

Source: @RyanDetrick
3. Bad Noise: Here’s another angle on it… I’d previously chucked this file into my archives folder as I thought it was a barely useful chart, but I think the latest readings illustrate things quite well. This indicator combines the signal from the economic surprise index and policy uncertainty index (inverted) — basically the lower it is the more economic policy uncertainty there is and/or the worse economic data is vs forecast. This bad noise appears to be weighing on markets.

Source: Topdown Charts
4. Sentiment Souring: And it’s certainly showing up in sentiment with the slump in bullishness and surge in bearishness. The optimistic take is that this is good because it’s like a stealth correction and healthy reset. The pessimistic take is that this is one of those turning points that happens slowly at first and then all of a sudden.

Source: Topdown Charts Professional
5. Lighter Leveraged Trading: Another sign of shifting sentiment is the steady decline in the prevalence of trading in leveraged long vs short ETFs. While people aren’t rushing to place bearish bets yet, you can clearly see waning enthusiasm for making new large leveraged bullish bets.

Source: Topdown Charts
6. But Still Heavy Leverage: That’s the flow, here’s the stock — even with that tapering of bullishness, the extant leveraged long positioning is historic, and bear funds are barely holding on (contrarians take note).

Source: Topdown Charts Professional
7. The 2020 Effect: Another divergence —I thought this one interesting because yeah there’s an obvious bearish warning element to it, but also it appears as though 2020 was this paradigmatic peripeteia (on many fronts!). That divergence marked a tipping point acceleration in the rise of tech; culminating in the more recent AI-hype bull, but also marked a new phase in experimental monetary policy with the unprecedented large-scale global stimulus measures of 2020/21, and associated awakening the spirit of speculative greed (crypto, NFTs, SPACs, and so-on) which still seems to be alive and well.

Source: @ISABELNET_SA
8. Market Cap Mismatch: To echo those points, you can also kind of see this playing out here with US equities global market cap share weighting surging from 2020 —meanwhile its earnings share/weighting did rise too, but not nearly as much. This also indirectly highlights the risk in US equities (and opportunity in Global ex-US as valuation imbalances reach historic extremes).

Source: @MikeZaccardi
9. Rare Growth: Another interesting angle on US markets is how undiversified things are becoming, especially on the growth side — the chart below shows the Russell 1000 growth index down to a record low 394 names mid last year, while the Value index at a record high 871 (much more diversified). And as for concentration within that, “the top 10 weights of the Russell 1000 Growth Index comprise 61.0% of the index, compared to the Russell 1000 Value Index at 17.2%.” Stark stuff.

Source: SnippetFinance Glenmede IM
10. Always Something Better: Lastly, I thought this was an interesting way of looking at things — basically you can always find an asset that will outperform your portfolio… at once both a reminder to have a process to try and find those assets, but also not to get too swept up in FOMO as there will always be a better missed opportunity to your best found ones (so don’t let it rob your equanimity).

Source: Matteo Lombardo Mr Market Miscalculates
Margin Debt Acceleration Indicator: The just-released January margin debt data showed a further rate of expansion into what you might call the danger zone.

Whenever this indicator has surged into the red zone, markets tend to take a breather; at best a period of consolidation or garden variety correction… at worst, well the chart speaks for itself.
Like many indicators of this nature the most powerful signal comes when it reaches an extreme *and then turns down*. We don’t have that yet, but we definitely have another waving risk flag here. It’s a veritable festival of flags…
Disclosure: This article does not represent investment advice. The content and materials featured on this page are for educational purposes only.
This news was originally written by Callum Thomas, Head of Research and Founder @topdowncharts.
Related:
Bank of America Sees an ‘Attractive Entry Point’ in These 2 Stocks
Wall Street’s latest favorites – Hedge Funds’ Top Picks in Q4
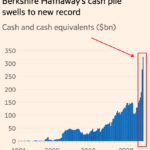
Warren Buffett Berkshire now hold a record $334 BILLION in cash, What does he know that we don’t?
Key Earnings Takeaways from This Week: AI, E-Commerce, and Travel Stocks Lead Market
Will Elon Musk Enter Quantum Computing? Here’s Why It Might Happen in 2025
Intel Turbulent Week: Breakup Rumors, Strategic Deals, and What It Means for $INTC Stock
Nvidia CEO Jensen Huang directly addresses DeepSeek stock sell-off, saying investors got it wrong
Gold market cap hit $20 TRILLION for first time in history. Why are people still piling into gold?
Analysis: Is Kelsier’s $200MM insider trading scandal the next FTX?
How Dirty Money From Fentanyl Sales Is Flowing Through China
Trump plans to impose 25% tariffs on autos, chips and pharmaceuticals – Stock Market Impact
Congressional Stock Trading Scandal: Lawmakers Profit Big on Palantir Stock Surge