
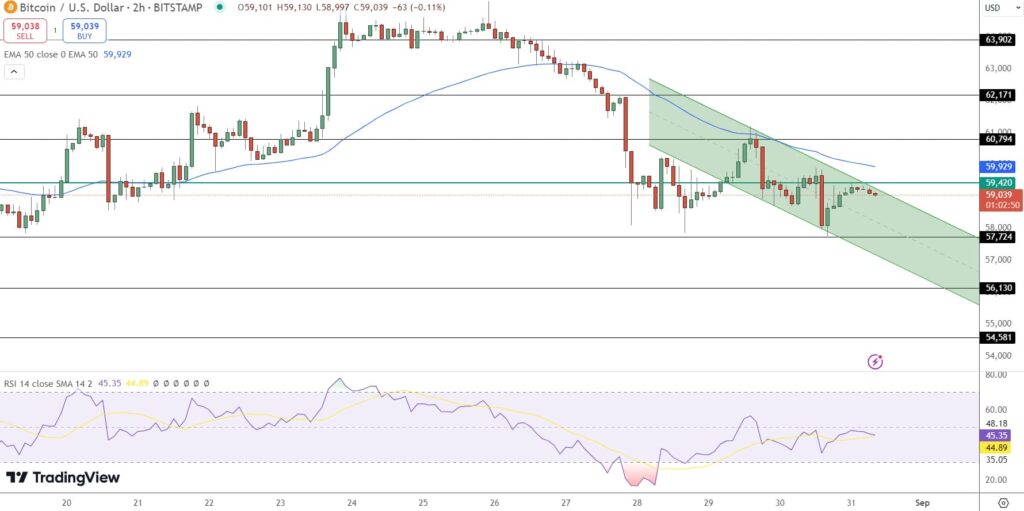
Bitcoin (BTC/USD) continues to struggle below the $59,420 resistance level, trading around $59,039. This key resistance has proven difficult to surpass, with Bitcoin facing rejection multiple times. The market is showing signs of bearish sentiment, with traders cautious about the next move.
The persistent downward channel on the 2-hour chart suggests that Bitcoin may continue to face downward pressure. The Relative Strength Index (RSI) is hovering at 45.35, indicating that there is still room for further declines if selling pressure increases. If Bitcoin fails to break above the $59,420 resistance level soon, the price could potentially drop to the next support level around $57,724.
In addition to technical indicators, market sentiment is being influenced by broader economic factors, including recent discussions around Bitcoin-backed loans and increased interest from mainstream financial institutions. However, the inability to break above this resistance level keeps the bearish outlook intact for now.
As Bitcoin hovers at this critical juncture, traders and investors should watch the $59,420 resistance closely. A successful breakout could change the current trend, but failure to do so may reinforce the bearish momentum, leading to further declines in the near term.